Help & Documentation
  • Home
  • Sign In
  • Contact Us
  • Home
  • Sign In
  • Contact Us

10 year T-Note up to 140.1795

/Futures Technical Analysis - TD/10 year T-Note up to 140.1795

10 year T-Note up to 140.1795

Posted on March 16, 2020 by admin wrote in Futures Technical Analysis - TD.

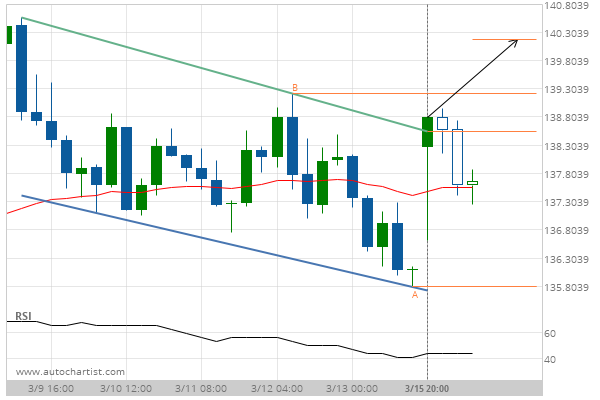
Flag has broken through the resistance line at 15-Mar-2020 20:00 EDT. Possible bullish price movement forecast for the next 21 hours towards 140.1795.

Tags: CBOT, ZN
0 Likes
209 Views

You may also like

Corn up to 430.2500
Corn up to 430.2500
June 12, 2019
Corn down to 309.2500
April 30, 2020
US T-Bond down to 180.7188
May 18, 2020

Comments are closed.

Verizon Communications Inc. () up to 57.58 US T-Bond up to 187.8266

Futures Technical Analysis – TD

US T-Bond up to 169.4625

January 25, 2021 11:18 am | By admin

Broke through Resistance level of 169.0313 at 25-Jan-2021 04:45 EST Read more →

Soybean Meal up to 447.0000

January 25, 2021 11:17 am | By admin

Channel Down identified at 25-Jan-2021 03:00 EST. This pattern is... Read more →

Gold Front Month up to 1874.6000

January 25, 2021 11:17 am | By admin

Rising Wedge identified at 24-Jan-2021 20:00 EST. This pattern is... Read more →

10 year T-Note up to 137.0781

January 25, 2021 11:17 am | By admin

Ascending Triangle identified at 25-Jan-2021 05:00 EST. This pattern is... Read more →

Soybeans up to 1387.0000

January 25, 2021 11:17 am | By admin

Channel Down identified at 25-Jan-2021 04:00 EST. This pattern is... Read more →

  • About Us
  • Privacy Policy
  • Disclaimer
  • Terms and Conditions
  • Get started for FREE
  • Contact Us
Copyright © 2020 Autochartist.com. All rights reserved.
This site uses cookies: Find out more.