Help & Documentation
  • Home
  • Sign In
  • Contact Us
  • Home
  • Sign In
  • Contact Us

10 year T-Note up to 138.5625

/Futures Technical Analysis - TD/10 year T-Note up to 138.5625

10 year T-Note up to 138.5625

Posted on March 26, 2020 by admin wrote in Futures Technical Analysis - TD.

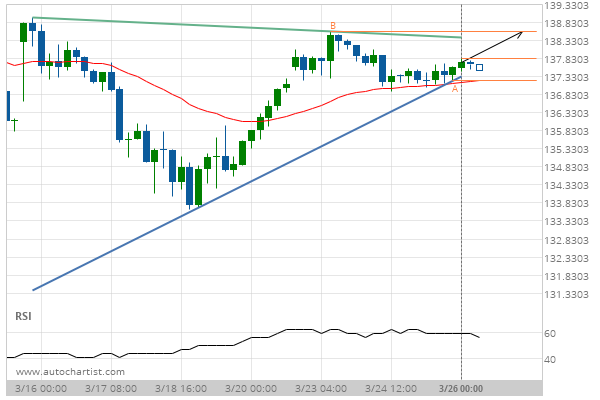
Triangle identified at 26-Mar-2020 00:00 EDT. This pattern is still in the process of forming. Possible bullish price movement towards the resistance 138.5625 within the next 2 days.

Tags: CBOT, ZN
0 Likes
207 Views

You may also like

E-mini S&P 500 up to 2724.7972
April 1, 2020
Corn up to 403.2500
Corn up to 403.2500
November 4, 2020
US T-Bond up to 145.9063
March 12, 2019

Comments are closed.

Unitedhealth Group Inc. (UNH) excessive bearish movement Light Sweet Crude Oil Front Month down to 20.8000

Futures Technical Analysis – TD

KC HRW Wheat down to 647.5000

January 19, 2021 11:18 am | By admin

Triangle identified at 19-Jan-2021 06:00 EST. This pattern is still... Read more →

Silver Front Month up to 26.5142

January 19, 2021 11:18 am | By admin

Falling Wedge has broken through the resistance line at 19-Jan-2021... Read more →

Soybean Oil down to 40.6280

January 19, 2021 11:18 am | By admin

Broke through Support level of 41.4800 at 19-Jan-2021 05:00 EST Read more →

Light Sweet Crude Oil Front Month up to 53.1200

January 19, 2021 11:18 am | By admin

Approaching Resistance level of 53.1200 identified at 19-Jan-2021 03:00 EST Read more →

10 year T-Note down to 136.4531

January 19, 2021 11:18 am | By admin

Approaching Support level of 136.4531 identified at 19-Jan-2021 00:00 EST Read more →

  • About Us
  • Privacy Policy
  • Disclaimer
  • Terms and Conditions
  • Get started for FREE
  • Contact Us
Copyright © 2020 Autochartist.com. All rights reserved.
This site uses cookies: Find out more.