Help & Documentation
  • Home
  • Sign In
  • Contact Us
  • Home
  • Sign In
  • Contact Us

10 year T-Note up to 137.3440

/Futures Technical Analysis - TD/10 year T-Note up to 137.3440

10 year T-Note up to 137.3440

Posted on January 7, 2021 by admin wrote in Futures Technical Analysis - TD.

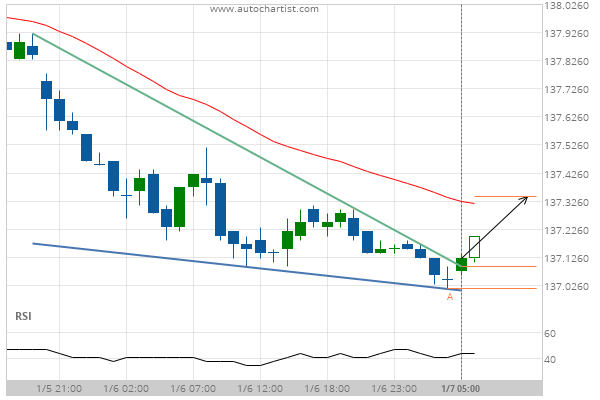
Falling Wedge has broken through the resistance line at 07-Jan-2021 05:00 EST. Possible bullish price movement forecast for the next 9 hours towards 137.3440.

Tags: CBOT-GBX, ZN
0 Likes
15 Views

You may also like

Gold Front Month down to 1530.1073
September 25, 2019
Soybean Oil down to 25.4071
May 6, 2020
Silver Front Month down to 27.8000
September 2, 2020

Comments are closed.

USD/CHF excessive bearish movement US T-Bond up to 170.0941

Futures Technical Analysis – TD

Soybean Meal up to 471.4000

January 18, 2021 11:16 am | By admin

Channel Up identified at 15-Jan-2021 12:00 EST. This pattern is... Read more →

Soybeans down to 1403.0000

January 18, 2021 11:16 am | By admin

Approaching Support level of 1403.0000 identified at 15-Jan-2021 12:30 EST Read more →

Gold Front Month down to 1800.8000

January 18, 2021 11:16 am | By admin

Channel Down identified at 18-Jan-2021 05:00 EST. This pattern is... Read more →

US T-Bond down to 168.0313

January 18, 2021 11:16 am | By admin

Triangle identified at 18-Jan-2021 05:00 EST. This pattern is still... Read more →

Corn down to 524.1489

January 18, 2021 11:16 am | By admin

Triangle has broken through the support line at 15-Jan-2021 09:00... Read more →

  • About Us
  • Privacy Policy
  • Disclaimer
  • Terms and Conditions
  • Get started for FREE
  • Contact Us
Copyright © 2020 Autochartist.com. All rights reserved.
This site uses cookies: Find out more.