Help & Documentation
  • Home
  • Sign In
  • Contact Us
  • Home
  • Sign In
  • Contact Us

10 year T-Note up to 127.2961

/Futures Technical Analysis - TD/10 year T-Note up to 127.2961

10 year T-Note up to 127.2961

Posted on July 17, 2019 by Autochartist wrote in Futures Technical Analysis - TD.

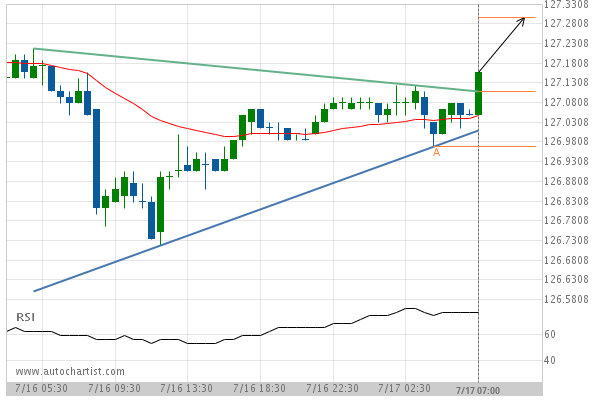
Triangle has broken through the resistance line at 17-Jul-2019 07:00 EDT. Possible bullish price movement forecast for the next 8 hours towards 127.2961.

Tags: CBOT, ZN
0 Likes
680 Views

You may also like

US T-Bond down to 168.4063
February 2, 2021
Silver Front Month down to 15.4498
February 14, 2019
Lean Hogs up to 66.3826
January 9, 2019

Comments are closed.

10 year US Treasury Note SEPTEMBER 2019 – resistance line breached Gold Front Month down to 1392.5903

Futures Technical Analysis – TD

Light Sweet Crude Oil Front Month up to 67.9800

March 9, 2021 11:17 am | By Autochartist

Rising Wedge identified at 09-Mar-2021 05:00 EST. This pattern is... Read more →

Feeder Cattle Front Month down to 137.2250

March 9, 2021 11:17 am | By Autochartist

Channel Down identified at 08-Mar-2021 14:00 EST. This pattern is... Read more →

Soybean Oil up to 53.2300

March 9, 2021 11:17 am | By Autochartist

Channel Up identified at 09-Mar-2021 04:30 EST. This pattern is... Read more →

Silver Front Month up to 26.5600

March 9, 2021 11:17 am | By Autochartist

Approaching Resistance level of 26.5600 identified at 09-Mar-2021 04:00 EST Read more →

10 year T-Note up to 133.1644

March 9, 2021 11:17 am | By Autochartist

Falling Wedge has broken through the resistance line at 09-Mar-2021... Read more →

  • About Us
  • Privacy Policy
  • Disclaimer
  • Terms and Conditions
  • Get started for FREE
  • Contact Us
Copyright © 2022 Autochartist.com. All rights reserved.
This site uses cookies: Find out more.