Help & Documentation
  • Home
  • Sign In
  • Contact Us
  • Home
  • Sign In
  • Contact Us

10 year T-Note up to 122.9375

/Futures Technical Analysis - TD/10 year T-Note up to 122.9375

10 year T-Note up to 122.9375

Posted on April 17, 2019 by admin wrote in Futures Technical Analysis - TD.

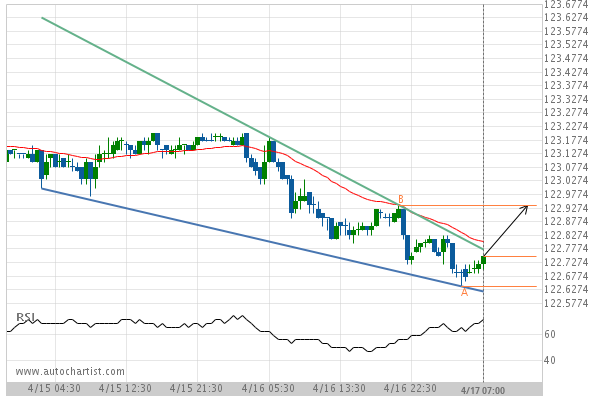
Falling Wedge identified at 17-Apr-2019 07:00 EDT. This pattern is still in the process of forming. Possible bullish price movement towards the resistance 122.9375 within the next 16 hours.

Tags: CBOT, ZN
0 Likes
416 Views

You may also like

Soybean Oil up to 31.6700
August 6, 2020
Soybean Meal down to 303.5000
April 24, 2019
Soybeans down to 863.2500
August 11, 2020

Comments are closed.

Corn down to 355.2500 E-mini S&P 500 up to 2921.2500

Futures Technical Analysis – TD

US T-Bond up to 169.4625

January 25, 2021 11:18 am | By admin

Broke through Resistance level of 169.0313 at 25-Jan-2021 04:45 EST Read more →

Soybean Meal up to 447.0000

January 25, 2021 11:17 am | By admin

Channel Down identified at 25-Jan-2021 03:00 EST. This pattern is... Read more →

Gold Front Month up to 1874.6000

January 25, 2021 11:17 am | By admin

Rising Wedge identified at 24-Jan-2021 20:00 EST. This pattern is... Read more →

10 year T-Note up to 137.0781

January 25, 2021 11:17 am | By admin

Ascending Triangle identified at 25-Jan-2021 05:00 EST. This pattern is... Read more →

Soybeans up to 1387.0000

January 25, 2021 11:17 am | By admin

Channel Down identified at 25-Jan-2021 04:00 EST. This pattern is... Read more →

  • About Us
  • Privacy Policy
  • Disclaimer
  • Terms and Conditions
  • Get started for FREE
  • Contact Us
Copyright © 2020 Autochartist.com. All rights reserved.
This site uses cookies: Find out more.