Help & Documentation
  • Home
  • Sign In
  • Contact Us
  • Home
  • Sign In
  • Contact Us

10 year T-Note excessive bearish movement

/Futures Statistical Analysis - TD/10 year T-Note excessive bearish movement

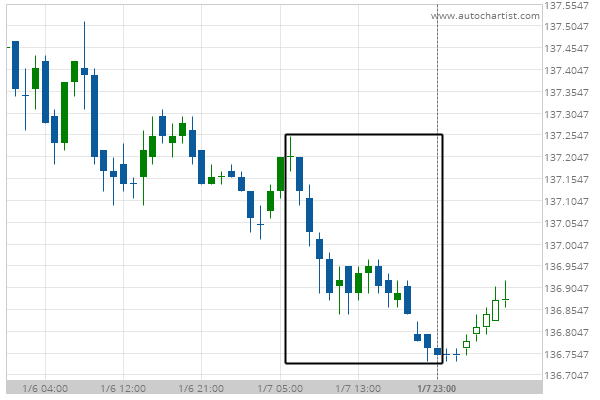
10 year T-Note excessive bearish movement

Posted on January 8, 2021 by Autochartist wrote in Futures Statistical Analysis - TD.

10 year T-Note experienced a 0.33% bearish movement in the last 17 hours.

Tags: Big Movement, ZN
0 Likes
366 Views

You may also like

Silver Front Month excessive bearish movement
December 11, 2018
Silver Front Month excessive bearish movement
February 26, 2021
CORN JULY 2020 excessive bullish movement
May 28, 2020

Comments are closed.

Trade of the Day: USD/JPY Soybeans excessive bearish movement

Futures Statistical Analysis – TD

Soybean Oil excessive bearish movement

March 9, 2021 11:16 am | By Autochartist

Soybean Oil experienced a 19.04% bullish movement in the last... Read more →

Corn excessive bearish movement

March 8, 2021 11:19 am | By Autochartist

Corn experienced a 4.61% bullish movement in the last 73... Read more →

Gold Front Month excessive bearish movement

March 8, 2021 11:19 am | By Autochartist

Gold Front Month experienced a 6.29% bearish movement in the... Read more →

Light Sweet Crude Oil Front Month excessive bearish movement

March 8, 2021 11:19 am | By Autochartist

Light Sweet Crude Oil Front Month experienced a 8.6% bullish... Read more →

10 year T-Note excessive bearish movement

March 8, 2021 11:19 am | By Autochartist

10 year T-Note experienced a 3.4% bearish movement in the... Read more →

  • About Us
  • Privacy Policy
  • Disclaimer
  • Terms and Conditions
  • Get started for FREE
  • Contact Us
Copyright © 2022 Autochartist.com. All rights reserved.
This site uses cookies: Find out more.