Help & Documentation
  • Home
  • Sign In
  • Contact Us
  • Home
  • Sign In
  • Contact Us

10 year T-Note down to 130.1713

/Futures Technical Analysis - TD/10 year T-Note down to 130.1713

10 year T-Note down to 130.1713

Posted on August 19, 2019 by Autochartist wrote in Futures Technical Analysis - TD.

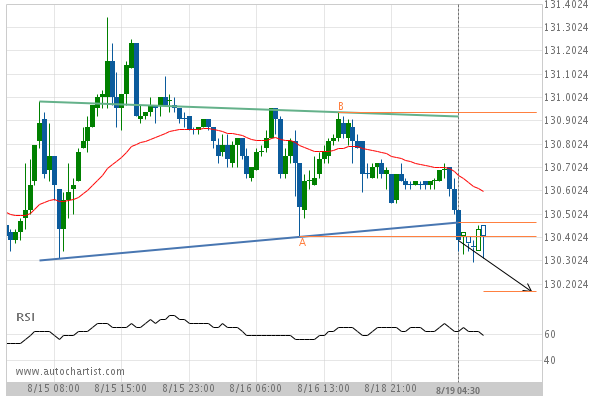
Head and Shoulders has broken through the support line at 19-Aug-2019 04:30 EDT. Possible bearish price movement forecast for the next 12 hours towards 130.1713.

Tags: CBOT, ZN
0 Likes
580 Views

You may also like

10 year T-Note up to 140.1875
August 3, 2020
Soybean Oil up to 34.8200
November 2, 2020
Gold Front Month up to 1529.0000
January 2, 2020

Comments are closed.

Nike Inc. Cl B (NKE) up to 84.12 Cisco Systems Inc. (CSCO) up to 52.81

Futures Technical Analysis – TD

Light Sweet Crude Oil Front Month up to 67.9800

March 9, 2021 11:17 am | By Autochartist

Rising Wedge identified at 09-Mar-2021 05:00 EST. This pattern is... Read more →

Feeder Cattle Front Month down to 137.2250

March 9, 2021 11:17 am | By Autochartist

Channel Down identified at 08-Mar-2021 14:00 EST. This pattern is... Read more →

Soybean Oil up to 53.2300

March 9, 2021 11:17 am | By Autochartist

Channel Up identified at 09-Mar-2021 04:30 EST. This pattern is... Read more →

Silver Front Month up to 26.5600

March 9, 2021 11:17 am | By Autochartist

Approaching Resistance level of 26.5600 identified at 09-Mar-2021 04:00 EST Read more →

10 year T-Note up to 133.1644

March 9, 2021 11:17 am | By Autochartist

Falling Wedge has broken through the resistance line at 09-Mar-2021... Read more →

  • About Us
  • Privacy Policy
  • Disclaimer
  • Terms and Conditions
  • Get started for FREE
  • Contact Us
Copyright © 2020 Autochartist.com. All rights reserved.
This site uses cookies: Find out more.