Help & Documentation
  • Home
  • Sign In
  • Contact Us
  • Home
  • Sign In
  • Contact Us

10 year T-Note down to 123.5846

/Futures Technical Analysis - TD/10 year T-Note down to 123.5846

10 year T-Note down to 123.5846

Posted on April 2, 2019 by Autochartist wrote in Futures Technical Analysis - TD.

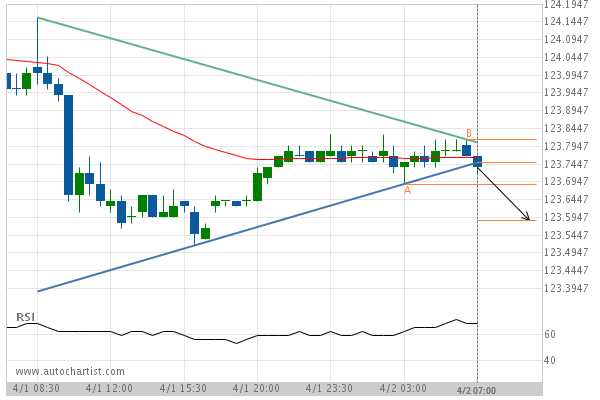
Triangle has broken through the support line at 02-Apr-2019 07:00 EDT. Possible bearish price movement forecast for the next 6 hours towards 123.5846.

Tags: CBOT, ZN
0 Likes
771 Views

You may also like

Soybean Oil down to 27.9500
June 10, 2020
KC HRW Wheat up to 442.7500
July 11, 2019
Light Sweet Crude Oil Front Month up to 26.6000
April 17, 2020

Comments are closed.

US T-Bond down to 148.2813 E-mini S&P 500 up to 2873.5000

Futures Technical Analysis – TD

Light Sweet Crude Oil Front Month up to 67.9800

March 9, 2021 11:17 am | By Autochartist

Rising Wedge identified at 09-Mar-2021 05:00 EST. This pattern is... Read more →

Feeder Cattle Front Month down to 137.2250

March 9, 2021 11:17 am | By Autochartist

Channel Down identified at 08-Mar-2021 14:00 EST. This pattern is... Read more →

Soybean Oil up to 53.2300

March 9, 2021 11:17 am | By Autochartist

Channel Up identified at 09-Mar-2021 04:30 EST. This pattern is... Read more →

Silver Front Month up to 26.5600

March 9, 2021 11:17 am | By Autochartist

Approaching Resistance level of 26.5600 identified at 09-Mar-2021 04:00 EST Read more →

10 year T-Note up to 133.1644

March 9, 2021 11:17 am | By Autochartist

Falling Wedge has broken through the resistance line at 09-Mar-2021... Read more →

  • About Us
  • Privacy Policy
  • Disclaimer
  • Terms and Conditions
  • Get started for FREE
  • Contact Us
Copyright © 2020 Autochartist.com. All rights reserved.
This site uses cookies: Find out more.