Goldman Sachs Group Inc. Target Level: 207.86
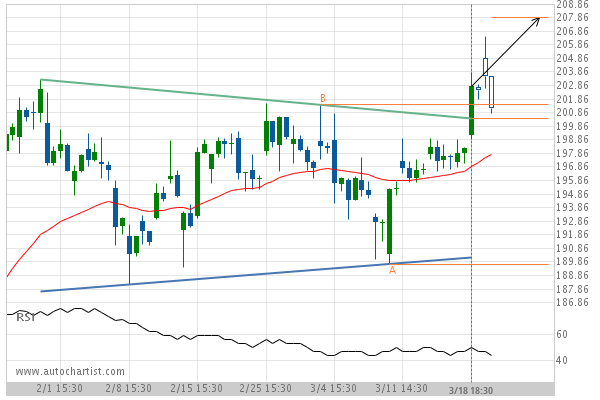
Triangle has broken through the resistance line at 18-Mar-2019 18:30 UTC. Possible bullish price movement forecast for the next 3 days towards 207.86.
Did you know that our social media feeds are updated only 3x per day, and don’t look at short term movements?
If you open a live account with a broker that support Autochartist, you’ll get:
Analysis as low as 15 minute data intervals Short term forecasts Risk and volatility information