Trade of the Day: GBP/USD
By: Dima Chernovolov
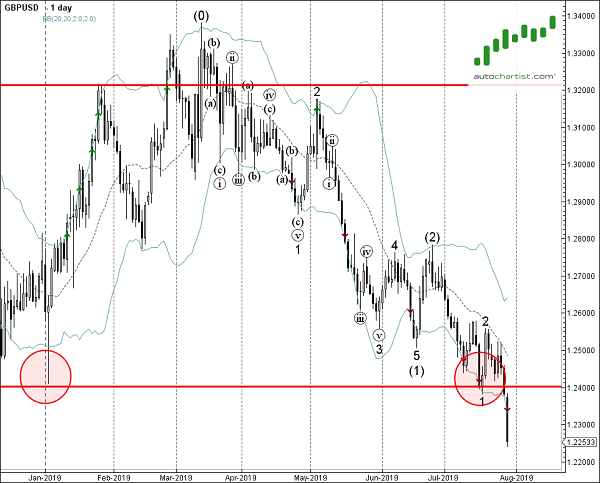
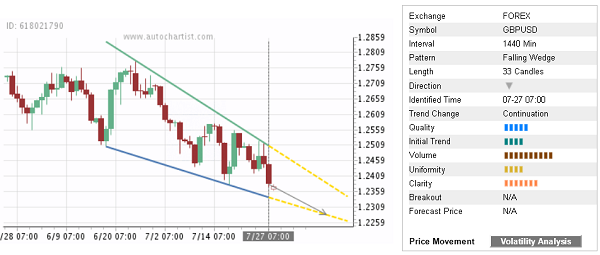
GBP/USD continues to fall inside the daily Falling Wedge chart pattern which was identified earlier by Autochartist. Autochartist rates the quality of this Falling Wedge at the 5-bar level – which is the result of the slow Initial Trend (4 bars), below-average Uniformity (4 bars) and significant Clarity (7 bars). GBP/USD is expected to fall further inside this Falling Wedge – in line with the earlier breakout of the key support level 1.2400 shown below.
As can be seen from the daily GBP/USD, the price earlier broke below the key support level 1.2400 (which previously reversed the price sharply in January and July). This price level is acting as strong resistance now. The proximity of this resistance level and the strength of the active daily downtrend increase the probability GBP/USD will continue to fall inside this Falling Wedge.