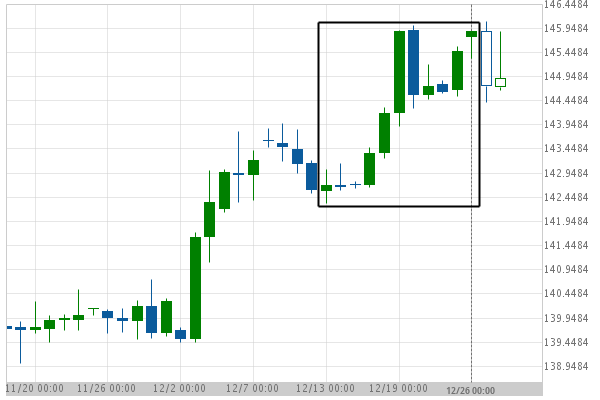
US T-Bond excessive bearish movement Posted on December 28, 2018 by Autochartist wrote in Futures Statistical Analysis - TD. US T-Bond experienced a 2.32% bullish movement in the last 13 days. Tags: Big Movement, ZB 0 Likes 1115 Views You may also like Soybean Oil excessive bearish movement January 16, 2020 Corn excessive bullish movement November 20, 2020 Gold Front Month excessive bearish movement June 21, 2019 Comments are closed.