Trade of the Day: NZD/USD
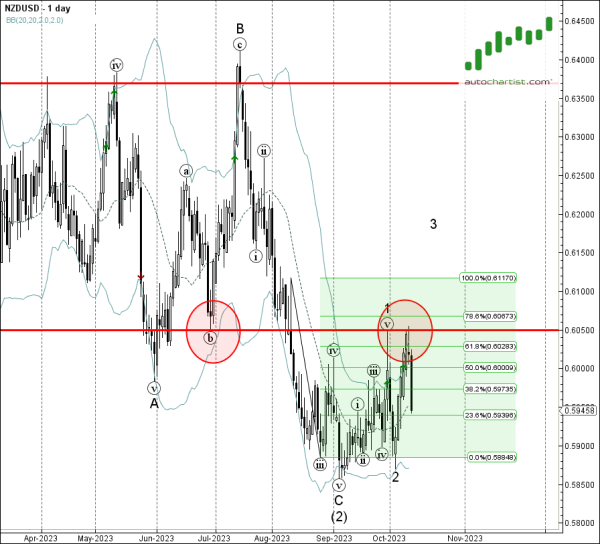
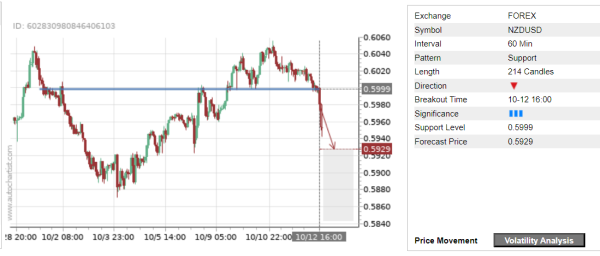
NZD/USD recently broke the key support level 0.5999, which was recently identified by Autochartist. Autochartist rates the significance of this support level at the 3-bar level – which is the result of the 3 previous reversals from this price level. NZD/USD is expected to fall toward the forecast level 0.5929.
As can be seen from the daily NZD/USD chart below – the pair earlier reversed down from the resistance zone located between the pivotal resistance level 0.6050 (former support from June) standing near with the upper daily Bollinger Band and the 61.8% Fibonacci correction of the downward impulse from August. The proximity of this resistance zone and the clear daily downtrend increase the probability NZD/USD will continue fall toward the forecast level 0.5929.