Trade of the Day: NZD/USD
By: Dima Chernovolov
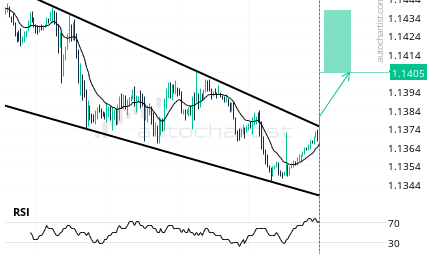
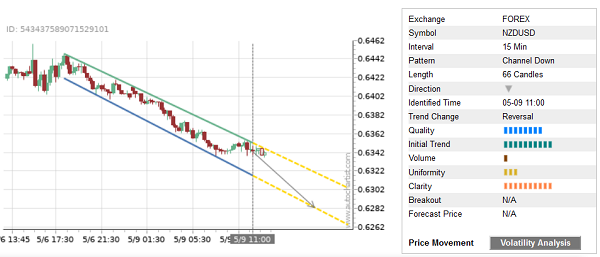
NZD/USD continues to fall inside the clear 15-minute Down Channel chart pattern, which was recently identified by Autochartist. Autochartist rates the quality of this Down Channel at the 8-bar level – which reflects the strong Initial Trend (10 bars), lower Uniformity (3 bars) and strong Clarity (9 bars). NZD/USD is expected to fall further inside this Down Channel.
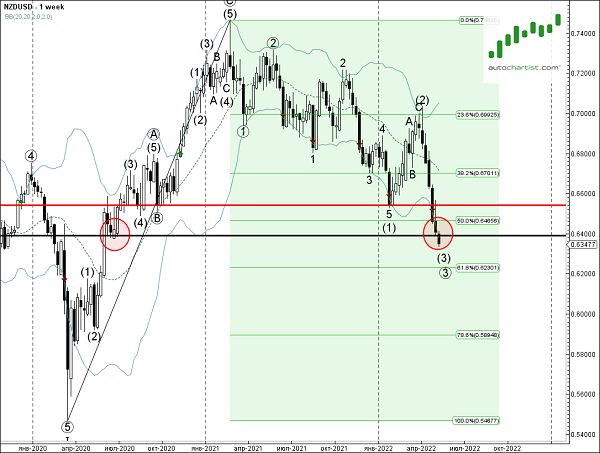
As can be seen from the weekly NZD/USD chart below – the price earlier broke the support area located between the key support 0.6400 (former support from the middle of 2020) and the 50% Fibonacci correction of the weekly uptrend from the start of 2020. This price zone is acting as the resistnace area after it was broken, The proximity of this resistance area increases the probability NZD/USD will continue to fall inside this Down Channel.