Trade of the Day: GBP/NZD
By: Dima Chernovolov
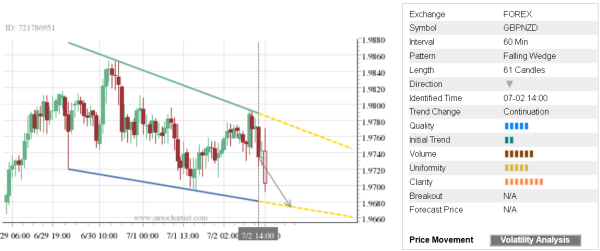
GBP/NZD continues to fall inside the hourly Falling Wedge chart pattern which was previously identified by Autochartist. Autochartist rates the quality of this Falling Wedge at the 5-bar level – which is the result of the slow Initial Trend (2 bars), medium Clarity (5 bars) and strong Uniformity (8 bars). GBP/NZD is expected to fall further inside this Falling Wedge.
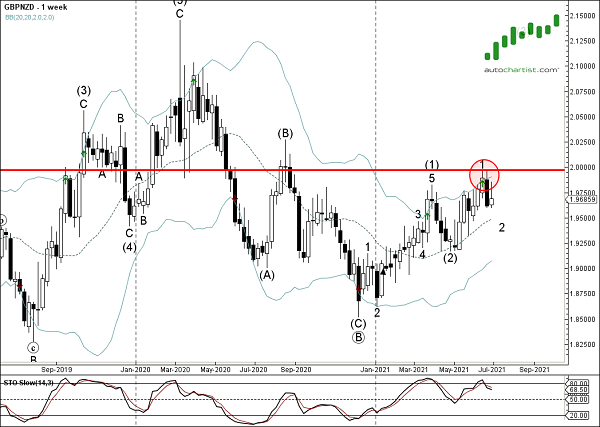
As can be seen from the weekly GBP/NZD chart below – the pair earlier reversed down from the resistance area located between the round resistance level 2.0000 and the upper weekly Bollinger Band. Clear bearish divergence on the weekly Stochastic indicator increase the proximity GBP/NZD will continue to fall inside this hourly Falling Wedge.