Trade of the Day: NZD/USD
By: Dima Chernovolov
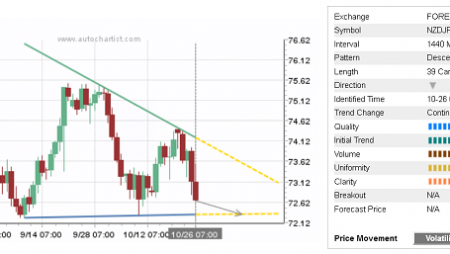
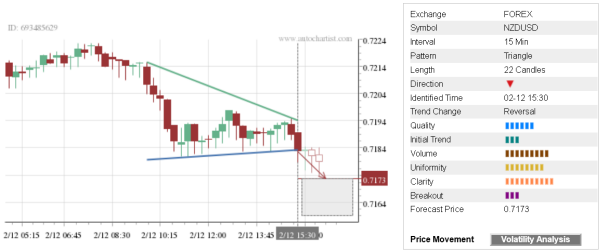
NZD/USD continues to fall after breaking the 15-minute Triangle chart pattern which was previously identified by Autochartist. Autochartist rates the quality of Up Triangle at the 6-bar level – which is the result of the slow Initial Trend (3 bars), strong Uniformity (8 bars) and maximum Clarity (10 bars). NZD/USD is expected to fall toward the forecast price 0.7173 – with the possible extension lower in the forecast range
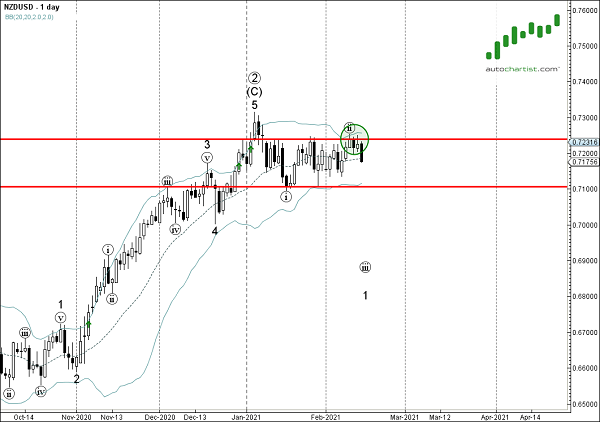
As can be seen from the daily NZD/USD chart below, the price earlier reversed down from the resistance area lying between the key multi-day resistance level 0.7240 (which has been steadily reversing the price from the start of January) and the upper daily Bollinger Band. The proximity of this resistance zone increases the probability NZD/USD will continue to fall toward the forecast price 0.7173.