Trade of the Day: USD/JPY
By: Dima Chernovolov
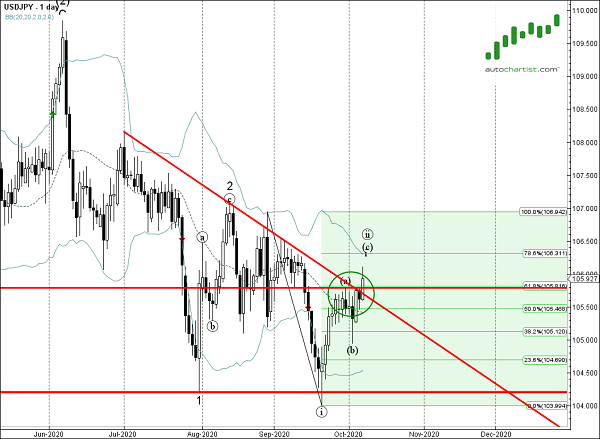
USD/JPY recently broke the 4-hour Ascending Triangle chart pattern, which was recently identified by Autochartist. Autochartist rates the quality of this Ascending Triangle at the 7-bar level – which is the result of the slow Initial Trend (4 bars) and significant Uniformity and Clarity (7 bars). USD/JPY is expected to rise toward the forecast price 106.17 – in line with the earlier breakout of the resistance zone shown below.
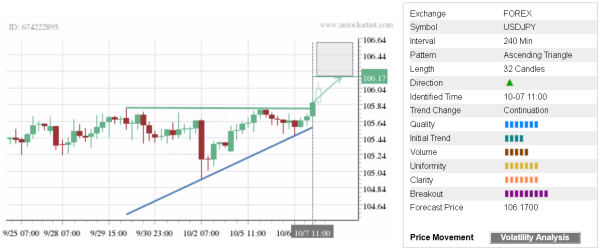
As can be seen from the daily USD/JPY chart below, the price earlier broke the resistance zone located between the resistance level 105.80 (which reversed the price in September), 61.8% Fibonacci correction of the downward impulse from August and the resistance trendline from June. This price area is acting as the strong support after it was broken. The proximity of this support area adds to the probability USD/JPY will continue to rise toward the forecast price 106.17.
.