Trade of the Day: NZD/CHF
By: Dima Chernovolov
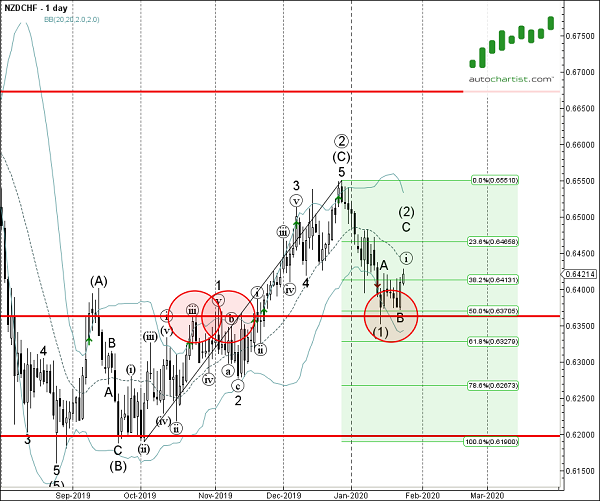
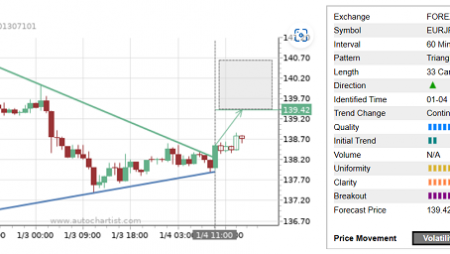
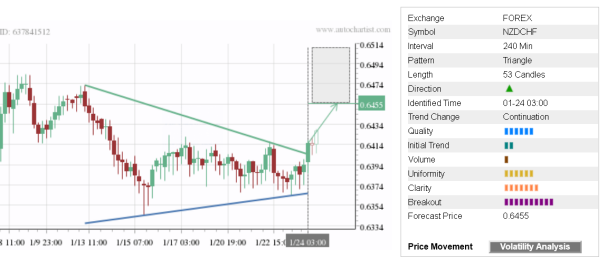
NZD/CHF recently broke the 4-hour Triangle chart pattern which was previously identified by Autochartist. Autochartist rates the quality of this Triangle at the 6-bar level – which is the result of the slow Initial Trend (2 bars), above-average Uniformity (6 bars) and stronger Clarity (7 bars). NZD/CHF is expected to rise toward the forecast price 0,6455 – in line with the earlier upward reversal from the support zone highlighted below.
As can be seen from the daily NZD/CHF chart below – the bottom of this Triangle formed when the pair reversed up from the support area lying between the pivotal support level 0.6360 (former resistance from October and November), lower daily Bollinger Band and the 50% Fibonacci correction of the previous sharp upward impulse from September. The proximity of this support area adds to the probability NZD/CHF will continue to rise toward the forecast price 0,6455.