Торговля дня: USD / JPY
От: Dima Chernovolov
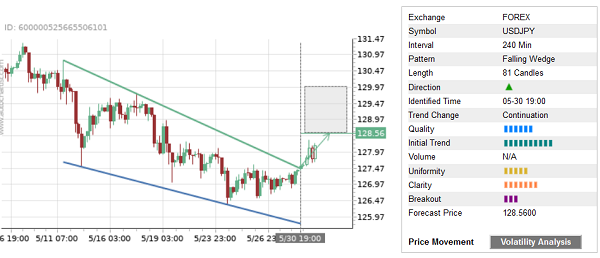
USD/JPY recently broke the 4-hour Falling Wedge chart pattern, который был недавно идентифицирован Autochartist. Autochartist оценивает качество этого падающего клина на уровне 6 баров, что является результатом сильного начального тренда (9 брусья), средняя Однородность (5 брусья) и выше четкость (7 брусья). USD / JPY, как ожидается, вырастет в стороне прогноза цен 128.56.
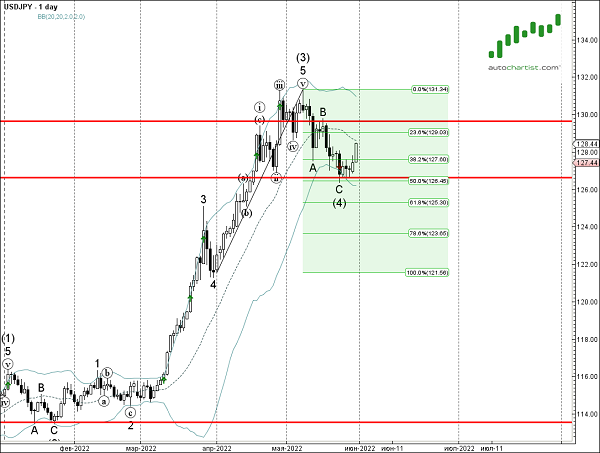
As can be seen from the daily USD/JPY chart below – the price recently reversed up from the support zone located between the support level 126.65 (which has been reversing the pair from the end of April), ниже ежедневно Боллинджера и 50% Коррекция Фибоначчи восходящего импульса от марта. The proximity of this support area and the clear daily uptrend increase the probability USD/JPY will continue to rise toward the forecast price 128.56.