Торговля дня: USD / JPY
От: Dima Chernovolov
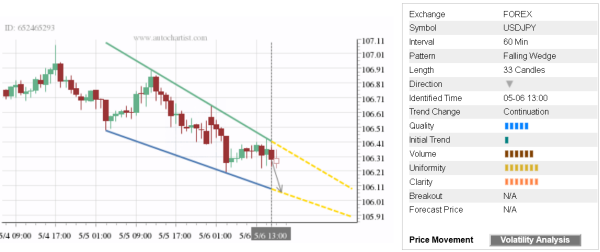
USD/JPY continues to fall inside the hourly Falling Wedge chart pattern which was recently identified by Autochartist. Autochartist оценивает качество этой Нисходящий клин на уровне 5-бар - который является результатом медленного Начального Тренда (1 бар) и значительная Однородность и Ясность (оба оцененные на 7 уровень бар). USD/JPY is expected to fall further inside this chart pattern – in line with the earlier breakout of the support area shown below.
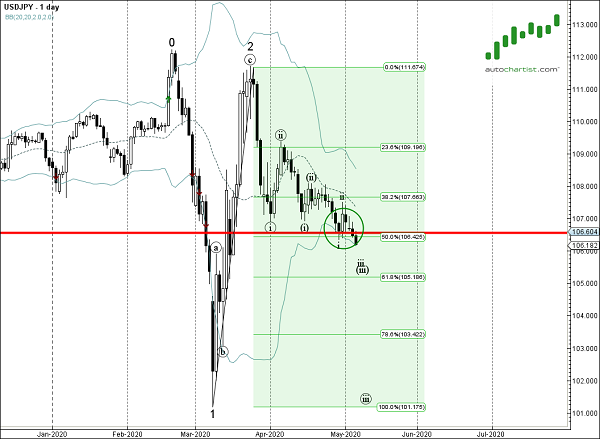
As can be seen from the daily USD/JPY chart below – the pair recently broke the support area lying between the key support level 106.60 (which stopped the previous downward impulse in April) и 50% Fibonacci correction of the earlier sharp upward price correction from March. Эта зона цена действует в качестве области сопротивления после того, как она была сломана. The proximity of this resistance area increases the probability USD/JPY will continue to decline inside this Falling Wedge.