Торговля дня: USD / CAD
От: Dima Chernovolov
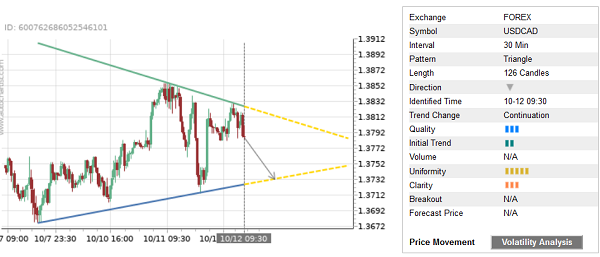
USD/CAD continues to fall inside the 30-minute Triangle chart pattern, который был недавно идентифицирован Autochartist. Autochartist оценивает качество этого треугольника на уровне 3 баров, что является результатом медленного начального тренда (2 брусья), средняя Однородность (5 брусья) и ниже Ясность (3 брусья). USD/CAD is expected to fall further inside this Triangle.
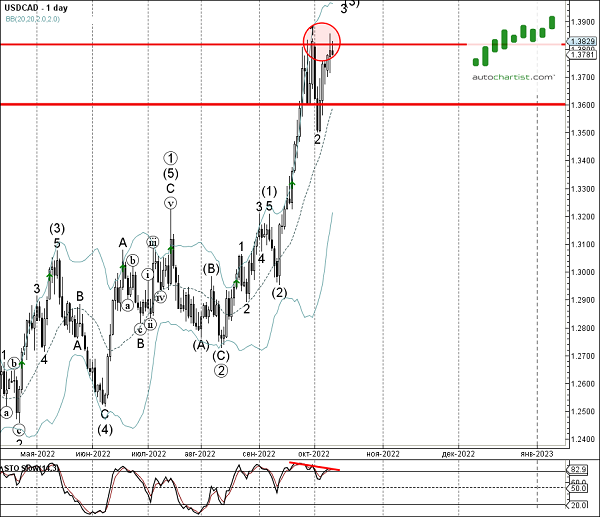
As can be seen from the daily USD/CAD chart below – the pair earlier reversed down from the key resistance level 1.3820 (which has been reversing the pair from the end of September). Given the clear bearish divergence of the daily Stochastic indicator and the proximity of the resistance level 1.3820, USD/CHF is likely to continue to fall further inside this Triangle.