Торговля дня: NZD / USD
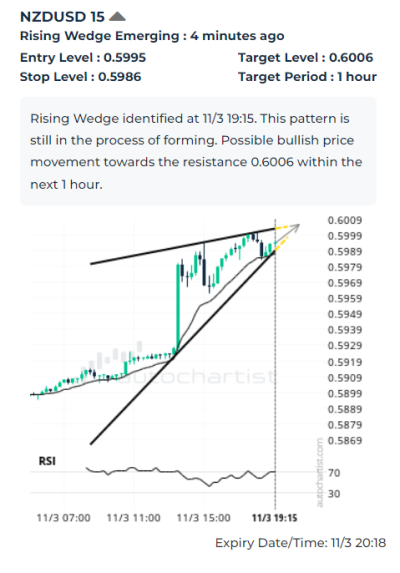
Пара NZD/USD растет в рамках 15-минутной фигуры «Восходящий клин», который был недавно идентифицирован Autochartist. Модель графика указывает на возможное бычье движение цены к целевому уровню. 0.6006. Ниже приведены оптимальные уровни входа и стоп-лосса, рассчитанные Autochartist.: вход в 0.5995 с защитным стоп-лоссом на 0.5986.
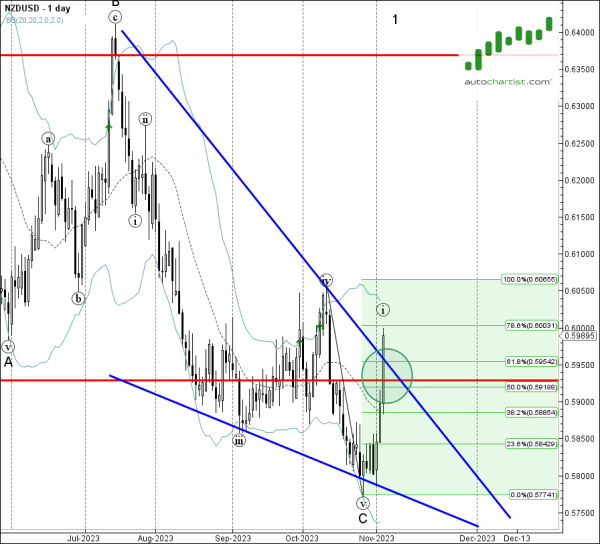
As can be seen from the daily NZD/USD chart below – the pair earlier broke the resistance level 0.5930, coinciding with the resistance trendline of the daily Falling Wedge from July and the 50% Fibonacci correction of the downward impulse from the start of October. All of these price levels are acting now as the support after they were broken. The proximity of these support levels adds to the probability NZD/USD will continue to rise toward the target level 0.6006.