Торговля дня: NZD / USD
От: Dima Chernovolov
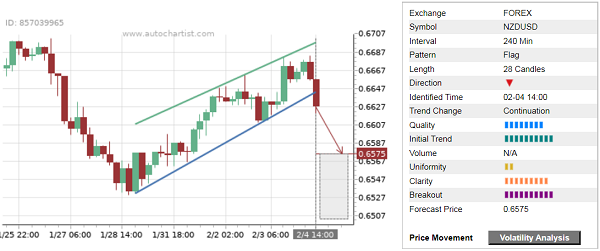
NZD/USD continues to fall after breaking the 4-hour Flag chart pattern, который ранее был идентифицирован Autochartist. Autochartist оценивает качество этого флага на высоком уровне в 8 делений, что является результатом сильного исходного тренда. (10 брусья), низкая Однородность (2 брусья) и почти максимальная Ясность (9 брусья). Ожидается, что NZD / USD упадет до прогнозируемой цены 0.6575.
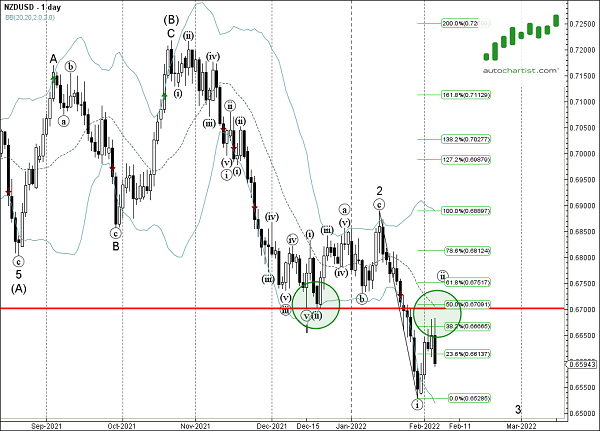
As can be seen from the daily NZD/USD chart below – the pair earlier reversed down from the resistance zone located between the key resistance level 0.6700 (former Double Bottom from December) и 50% Fibonacci correction of the previous downward impulse from the start of January. The proximity of this resistance zone and the clear daily downtrend increase the probability NZD/USD will continue to fall toward the forecast price 0.6575.