Торговля дня: NZD / USD
От: Dima Chernovolov
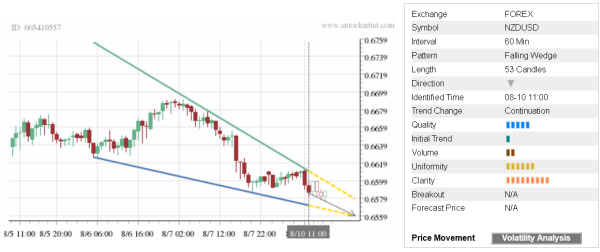
NZD/USD continues to fall inside the hourly Falling Wedge chart pattern which was recently identified by Autochartist. Autochartist оценивает качество этой Нисходящий клин на уровне 5-бар - который является результатом медленного Начального Тренда (1 бар), выше средняя Однородность (6 брусья) и почти максимальная Ясность (8 брусья). NZD/USD is expected to fall further inside this chart pattern – in line with the earlier downward reversal from the resistance zone shown below.
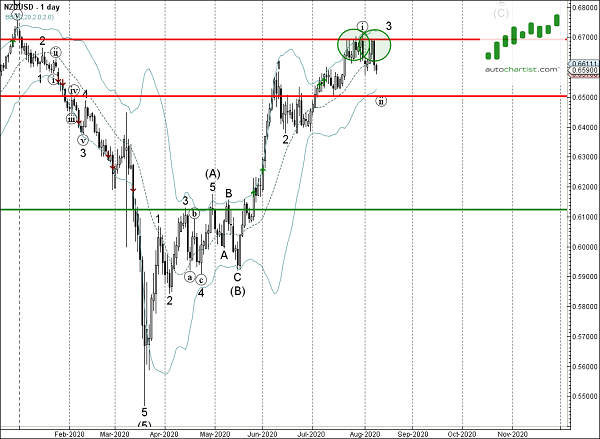
As can be seen from the daily NZD/USD chart below – the top of this Falling Wedge formed when the price reversed down with the daily Bearish Engulfing from the resistance area located between the resistance level 0.6700 (которая была реверсирование цены с самого начала 2020) и верхняя полоса Боллинджера ежедневно. The proximity of this resistance area adds to the probability NZD/USD will continue to fall inside this Falling Wedge.