Торговля дня: NZD / JPY
От: Dima Chernovolov
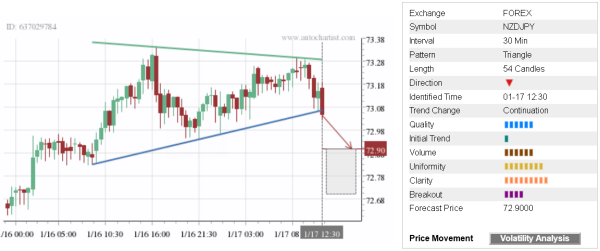
NZD/JPY recently broke the 30-minute Triangle chart pattern which was previously identified by Autochartist. Autochartist оценивает качество этого треугольника на уровне 6-бара - который является результатом медленного Начального Тренда (1 бар), значительная Однородность (8 брусья) и высокая четкость (9 брусья). NZD/JPY recently is expected to fall toward the forecast price 72.90 - в соответствии с ранее нисходящим разворотом от области сопротивления показано ниже.
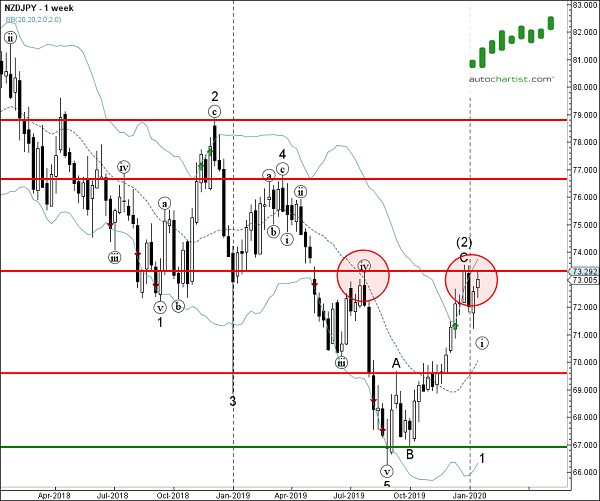
As can be seen from the weekly NZD/JPY chart below – the top of this Triangle formed when the pair reversed down from the resistance area lying between the resistance level 73.30 (which has been reversing the price from last July) и верхняя полоса Боллинджера еженедельно. The proximity of this resistance area adds to the probability NZD/JPY will continue to fall toward the forecast price 72.90.