Торговля дня: NZD / CAD
От: Dima Chernovolov
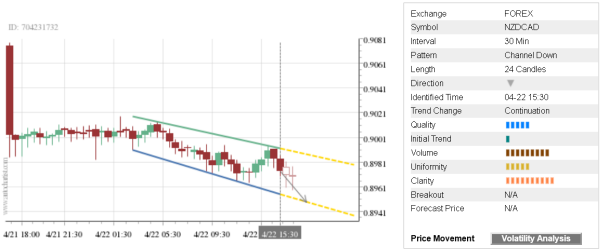
NZD/CAD continues to fall inside the 30-minute Down Channel chart pattern which was previously identified by Autochartist. Autochartist оценивает качество нисходящего канала на уровне 5 столбцов, что является результатом медленного начального тренда. (1 бар), средняя Однородность (5 брусья) и максимальная Ясность (10 брусья). NZD/CAD is expected to fall further inside this Down Channel.
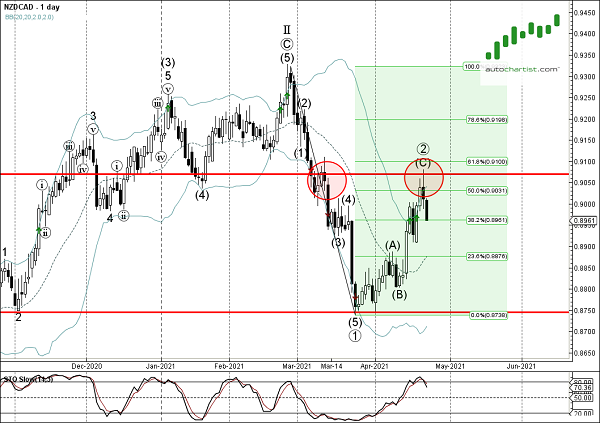
As can be seen from the daily NZD/CAD chart below – the price earlier reversed down from the resistance zone lying between the resistance level 0.9070 (which also stopped the price at the start of March), Верхняя ежедневно Боллинджера и 61.8% Коррекция Фибоначчи нисходящего импульса от февраля. The proximity of this resistance area adds to the probability /CAD will continue to fall inside this Down Channel.