Торговля дня: CAD / CHF
От: Dima Chernovolov
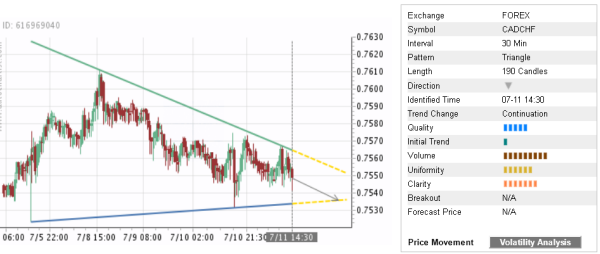
CAD/CHF continues to fall inside the 30-minute Triangle chart pattern which was earlier identified by Autochartist. Autochartist оценивает качество этого треугольника на уровне 5-бара - который является результатом медленного Начального Тренда (1 бар), выше средняя Однородность (6 брусья) и выше четкость (7 брусья). CAD/CHF is expected to fall further inside this Triangle – in line with the earlier downward reversal from the key resistance area shown below.
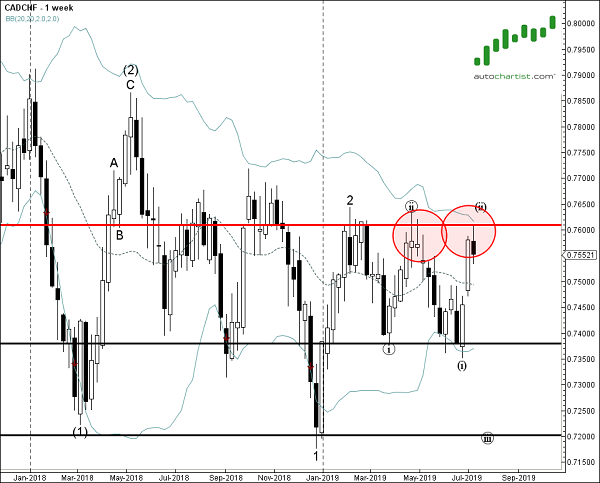
As can be seen from the weekly CAD/CHF chart below, the top of this Triangle formed when the price reversed down from the powerful resistance area lying between the key resistance level 0.7609 and the upper lower weekly Bollinger Band. The proximity of this resistance area increases the probability CAD/CHF will continue to fall inside this Triangle.