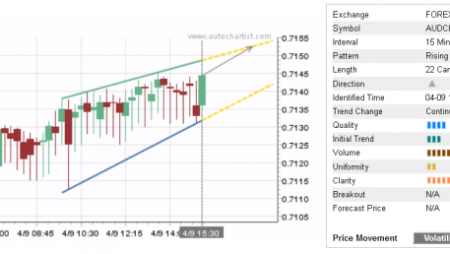
Торговля дня: AUD / USD
Пара AUD/USD падает внутри 30-минутного паттерна «Нисходящий клин», который был недавно идентифицирован Autochartist. Фигура на графике указывает на возможное медвежье движение цены к целевому уровню. 0.6392. Ниже приведены оптимальные уровни входа и стоп-лосса, рассчитанные Autochartist.: вход в 0.6413 с защитным стоп-лоссом на 0.6435.

As can be seen from the weekly AUD/USD chart below – the pair earlier reversed down from the key resistance level 0.6500 (former multi-month support from May), coinciding with the 20-weekly moving average and the 38.2% Fibonacci correction of the downward impulse from the middle of this year. The strength of resistance level 0.6500 increases the probability AUD/USD will continue to fall toward the target level 0.6392.


