Торговля дня: AUD / CAD
От: Dima Chernovolov
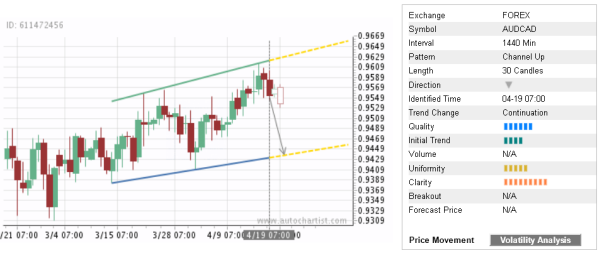
AUD/CAD continues to fall inside the daily Up Channel chart pattern which was recently identified by Autochartist. Autochartist оценивает качество ежедневного этого Up Channel на уровне 6-бара - который является результатом ниже среднего Начального Тренда (4 брусья), средняя Однородность (5 брусья) и почти максимальная Ясность (8 брусья). AUD/CAD is expected to fall further inside this Up Channel – in line with the earlier downward reversal from the key resistance area shown below.
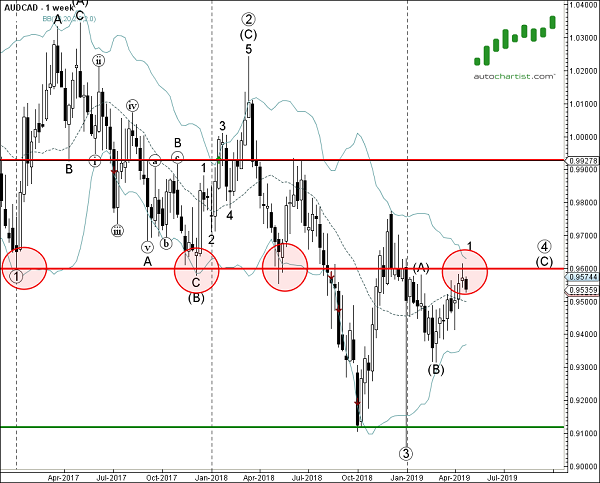
As can be seen from the weekly AUD/CAD below, the top of this Up Channel formed when the price reversed down from the resistance area lying between the key resistance level 0.9600 (former multi-month support from 2017 а также 2018) и верхняя полоса Боллинджера еженедельно. The proximity of this resistance area adds to the probability AUD/CAD will continue to fall inside this Channel.