Ежедневное обновление Forex: AUD / JPY
От: Dima Chernovolov
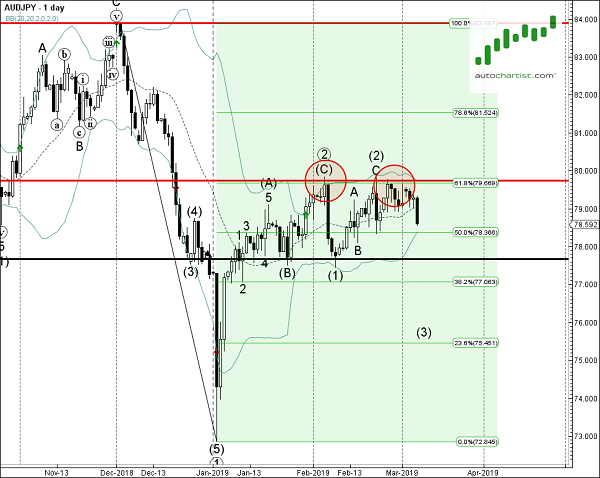
AUD/JPY continues to fall inside the daily Rectangle chart pattern which was previously identified by Autochartist. Autochartist оценивает качество этой Прямоугольник диаграммы на уровне 7-бара - который является результатом медленного Начального Тренда (3 брусья), сильная Однородность (8 брусья) и почти максимальная Ясность (9 брусья). AUD/JPY is expected to fall further inside this Rectangle – in line with the earlier downward reversal from the key resistance area shown below.
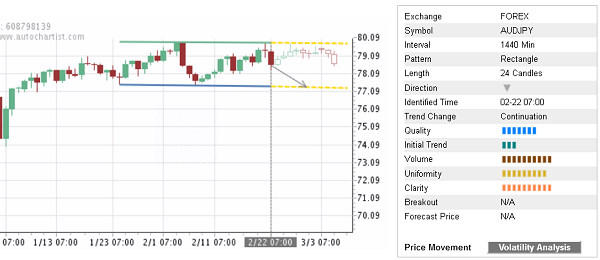
As can be seen from the daily AUD/JPY below, the top of this Rectangle formed when the price reversed down from the the resistance area lying between the key resistance level 79.70 (которая была реверсирование цены с февраля), Верхняя ежедневно Боллинджера и 61.8% Fibonacci correction of the previous downward impulse from December. The proximity of this resistance area increases the probability AUD/JPY will continue to fall inside this Rectangle.