XAG/USD approaching support of a Triangle
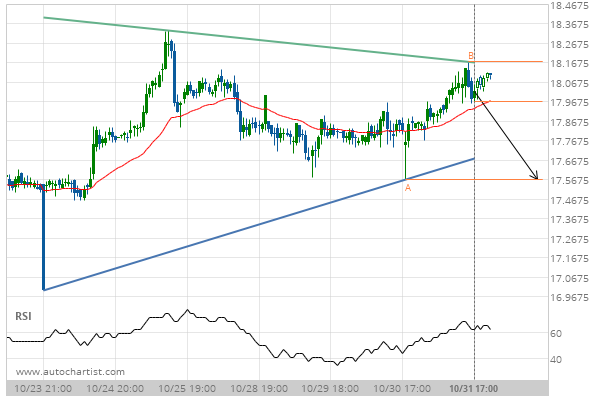
XAG/USD is approaching the support line of a Triangle. It has touched this line numerous times in the last 8 days. If it tests this line again, it should do so in the next 2 days.
Did you know that our social media feeds are updated only 3x per day, and don’t look at short term movements?
If you open a live account with a broker that support Autochartist, you’ll get:
Analysis as low as 15 minute data intervals Short term forecasts Risk and volatility information