Help & Documentation
  • Home
  • Sign In
  • Contact Us
  • Home
  • Sign In
  • Contact Us

Visa (V) up to 187.24

/US Stocks Technical Analysis - TD/Visa (V) up to 187.24

Visa (V) up to 187.24

Posted on March 2, 2020 by Autochartist wrote in US Stocks Technical Analysis - TD.

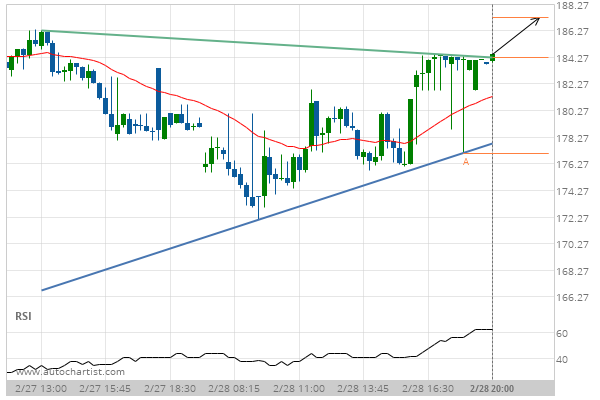
Triangle has broken through the resistance line at 28-Feb-2020 20:00 EST. Possible bullish price movement forecast for the next 7 hours towards 187.24.

Tags: NYSE, V, Visa
0 Likes
525 Views

You may also like

Procter & Gamble Co. (PG) up to 102.89
March 20, 2019
3m Co. (MMM) down to 164.29
July 11, 2019
Coca-Cola Co. (KO) down to 55.82
January 15, 2020

Comments are closed.

Travelers Cos Inc. (TRV) down to 117.38 Unitedhealth Group Inc. () up to 265.50

US Stocks Technical Analysis – TD

Merck & Co. Inc. (MRK) up to 75.56

March 9, 2021 11:13 am | By Autochartist

Rising Wedge identified at 08-Mar-2021 19:30 EST. This pattern is... Read more →

Jpmorgan Chase & Co. (JPM) down to 147.97

March 9, 2021 11:13 am | By Autochartist

Channel Up identified at 08-Mar-2021 19:00 EST. This pattern is... Read more →

Visa (V) down to 215.41

March 9, 2021 11:13 am | By Autochartist

Triangle identified at 08-Mar-2021 20:00 EST. This pattern is still... Read more →

Home Depot Inc. (HD) down to 247.10

March 9, 2021 11:13 am | By Autochartist

Channel Down identified at 08-Mar-2021 16:00 EST. This pattern is... Read more →

Intel Corporation () down to 58.10

March 9, 2021 11:13 am | By Autochartist

Approaching Support level of 58.10 identified at 08-Mar-2021 16:00 EST Read more →

  • About Us
  • Privacy Policy
  • Disclaimer
  • Terms and Conditions
  • Get started for FREE
  • Contact Us
Copyright © 2020 Autochartist.com. All rights reserved.
This site uses cookies: Find out more.