Help & Documentation
  • Home
  • Sign In
  • Contact Us
  • Home
  • Sign In
  • Contact Us

Visa (V) excessive bearish movement

/US Stocks Statistical Analysis - TD/Visa (V) excessive bearish movement

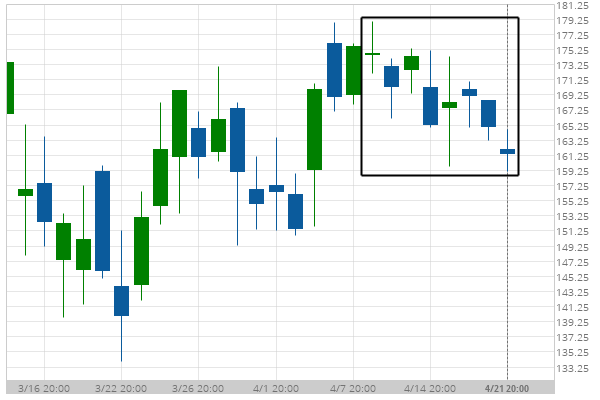
Visa (V) excessive bearish movement

Posted on April 22, 2020 by Autochartist wrote in US Stocks Statistical Analysis - TD.

Visa experienced a 7.67% bearish movement in the last 13 days.

Tags: V, Visa
0 Likes
409 Views

You may also like

Caterpillar Inc. (CAT) excessive bearish movement
February 23, 2021
Travelers Cos Inc. (TRV) excessive bullish movement
May 21, 2019
3m Co. (MMM) excessive bearish movement
February 26, 2020

Comments are closed.

Nike Inc. Cl B (NKE) down to 85.01 USD/CAD excessive bearish movement

US Stocks Statistical Analysis – TD

Walt Disney (DIS) excessive bullish movement

March 9, 2021 11:16 am | By Autochartist

Walt Disney experienced 4 consecutive bullish candles. Possible bearish price... Read more →

Chevron (CVX) excessive bearish movement

March 9, 2021 11:16 am | By Autochartist

Chevron experienced a 27.28% bullish movement in the last 36... Read more →

Boeing Co. (BA) excessive bearish movement

March 8, 2021 11:19 am | By Autochartist

Boeing Co. experienced 3 consecutive bearish candles. Possible bullish price... Read more →

3m Co. (MMM) excessive bullish movement

March 8, 2021 11:19 am | By Autochartist

3m Co. experienced 5 consecutive bullish candles. Possible bearish price... Read more →

Verizon Communications Inc. (VZ) excessive bullish movement

March 8, 2021 11:19 am | By Autochartist

Verizon Communications Inc. experienced 4 consecutive bullish candles. Possible bearish... Read more →

  • About Us
  • Privacy Policy
  • Disclaimer
  • Terms and Conditions
  • Get started for FREE
  • Contact Us
Copyright © 2020 Autochartist.com. All rights reserved.
This site uses cookies: Find out more.