Help & Documentation
  • Home
  • Sign In
  • Contact Us
  • Home
  • Sign In
  • Contact Us

Visa (V) excessive bearish movement

/US Stocks Statistical Analysis - TD/Visa (V) excessive bearish movement

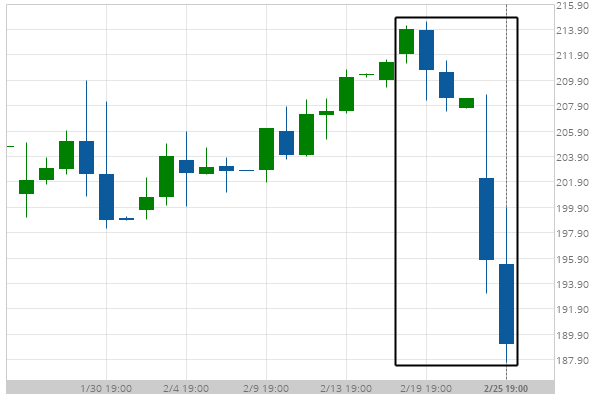
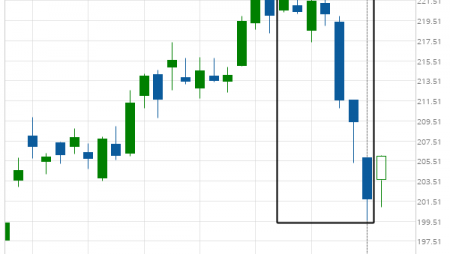
Visa (V) excessive bearish movement

Posted on February 26, 2020 by Autochartist wrote in US Stocks Statistical Analysis - TD.

Visa experienced a 10.54% bearish movement in the last 7 days.

Tags: V, Visa
0 Likes
635 Views

You may also like

Microsoft Corporation (MSFT) excessive bearish movement
June 12, 2019
3m Co. (MMM) excessive bearish movement
June 3, 2019
Chevron (CVX) excessive bullish movement
January 21, 2021

Comments are closed.

Coca-Cola Co. (KO) excessive bearish movement Unitedhealth Group Inc. (UNH) excessive bearish movement

US Stocks Statistical Analysis – TD

Walt Disney (DIS) excessive bullish movement

March 9, 2021 11:16 am | By Autochartist

Walt Disney experienced 4 consecutive bullish candles. Possible bearish price... Read more →

Chevron (CVX) excessive bearish movement

March 9, 2021 11:16 am | By Autochartist

Chevron experienced a 27.28% bullish movement in the last 36... Read more →

Boeing Co. (BA) excessive bearish movement

March 8, 2021 11:19 am | By Autochartist

Boeing Co. experienced 3 consecutive bearish candles. Possible bullish price... Read more →

Verizon Communications Inc. (VZ) excessive bullish movement

March 8, 2021 11:19 am | By Autochartist

Verizon Communications Inc. experienced 4 consecutive bullish candles. Possible bearish... Read more →

3m Co. (MMM) excessive bullish movement

March 8, 2021 11:19 am | By Autochartist

3m Co. experienced 5 consecutive bullish candles. Possible bearish price... Read more →

  • About Us
  • Privacy Policy
  • Disclaimer
  • Terms and Conditions
  • Get started for FREE
  • Contact Us
Copyright © 2022 Autochartist.com. All rights reserved.
This site uses cookies: Find out more.