Help & Documentation
  • Home
  • Sign In
  • Contact Us
  • Home
  • Sign In
  • Contact Us

Visa (V) excessive bearish movement

/US Stocks Statistical Analysis - TD/Visa (V) excessive bearish movement

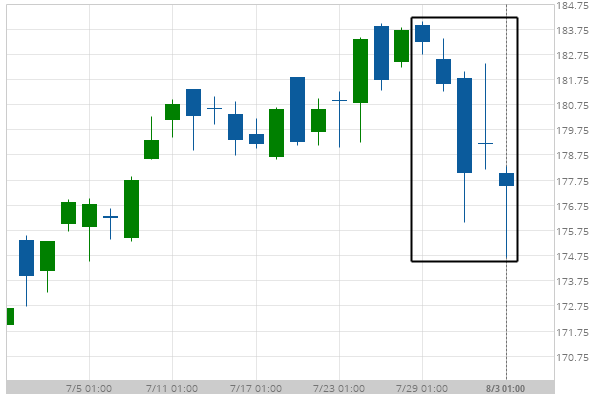
Visa (V) excessive bearish movement

Posted on August 5, 2019 by Autochartist wrote in US Stocks Statistical Analysis - TD.

Visa experienced a 3.49% bearish movement in the last 5 days.

Tags: V, Visa
0 Likes
762 Views

You may also like

Mcdonalds Corp. (MCD) excessive bearish movement
October 7, 2020
Wal-Mart Stores (WMT) excessive bullish movement
January 23, 2019
Merck & Co. Inc. (MRK) excessive bullish movement
March 21, 2019

Comments are closed.

Procter & Gamble Co. (PG) excessive bearish movement USD/CAD up to 1.3247

US Stocks Statistical Analysis – TD

Walt Disney (DIS) excessive bullish movement

March 9, 2021 11:16 am | By Autochartist

Walt Disney experienced 4 consecutive bullish candles. Possible bearish price... Read more →

Chevron (CVX) excessive bearish movement

March 9, 2021 11:16 am | By Autochartist

Chevron experienced a 27.28% bullish movement in the last 36... Read more →

Boeing Co. (BA) excessive bearish movement

March 8, 2021 11:19 am | By Autochartist

Boeing Co. experienced 3 consecutive bearish candles. Possible bullish price... Read more →

3m Co. (MMM) excessive bullish movement

March 8, 2021 11:19 am | By Autochartist

3m Co. experienced 5 consecutive bullish candles. Possible bearish price... Read more →

Verizon Communications Inc. (VZ) excessive bullish movement

March 8, 2021 11:19 am | By Autochartist

Verizon Communications Inc. experienced 4 consecutive bullish candles. Possible bearish... Read more →

  • About Us
  • Privacy Policy
  • Disclaimer
  • Terms and Conditions
  • Get started for FREE
  • Contact Us
Copyright © 2022 Autochartist.com. All rights reserved.
This site uses cookies: Find out more.