Help & Documentation
  • Home
  • Sign In
  • Contact Us
  • Home
  • Sign In
  • Contact Us

Visa () up to 191.68

/US Stocks Technical Analysis - TD/Visa () up to 191.68

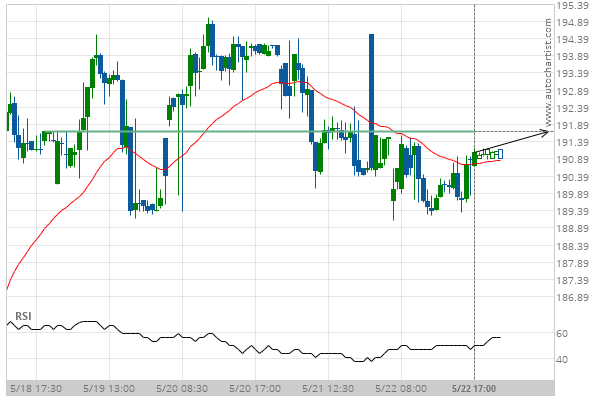
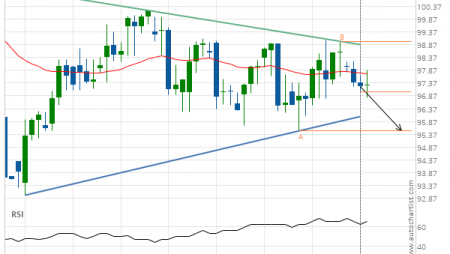
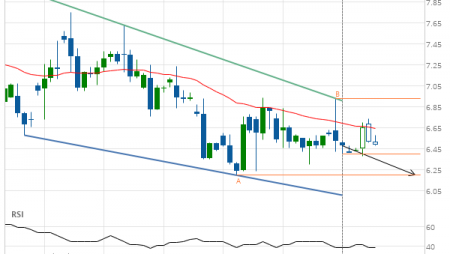
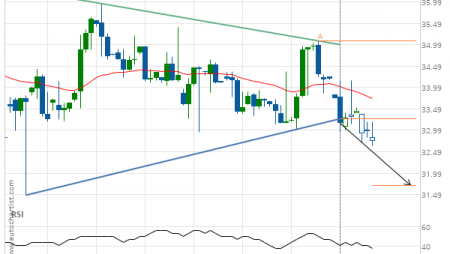
Visa () up to 191.68

Posted on May 26, 2020 by admin wrote in US Stocks Technical Analysis - TD.

Approaching Resistance level of 191.68 identified at 22-May-2020 17:00 EDT

Tags: V, Visa
0 Likes
153 Views

You may also like

Travelers Cos Inc. (TRV) up to 137.70
January 10, 2020
Microsoft Corporation (MSFT) down to 207.82
November 10, 2020
Caterpillar Inc. () down to 143.21
September 28, 2020

Comments are closed.

Goldman Sachs Group Inc. (GS) up to 184.12 Light Sweet Crude Oil Front Month up to 33.1000

US Stocks Technical Analysis – TD

Goldman Sachs Group Inc. (GS) down to 291.97

January 20, 2021 11:15 am | By admin

Rising Wedge has broken through the support line at 19-Jan-2021... Read more →

Jpmorgan Chase & Co. (JPM) down to 136.77

January 20, 2021 11:15 am | By admin

Falling Wedge identified at 19-Jan-2021 18:00 EST. This pattern is... Read more →

Exxon Mobil Corp. (XOM) up to 51.08

January 20, 2021 11:15 am | By admin

Channel Up identified at 19-Jan-2021 13:00 EST. This pattern is... Read more →

Nike Inc. Cl B () down to 135.96

January 20, 2021 11:15 am | By admin

Broke through Support level of 139.81 at 19-Jan-2021 12:00 EST Read more →

Caterpillar Inc. (CAT) down to 190.88

January 20, 2021 11:15 am | By admin

Descending Triangle identified at 19-Jan-2021 15:00 EST. This pattern is... Read more →

  • About Us
  • Privacy Policy
  • Disclaimer
  • Terms and Conditions
  • Get started for FREE
  • Contact Us
Copyright © 2020 Autochartist.com. All rights reserved.
This site uses cookies: Find out more.