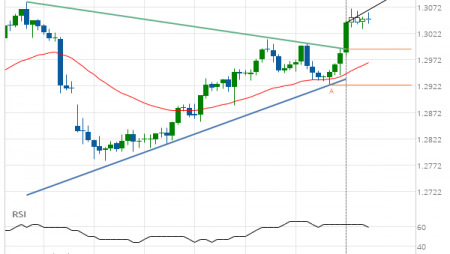
USD/JPY up to 111.8180
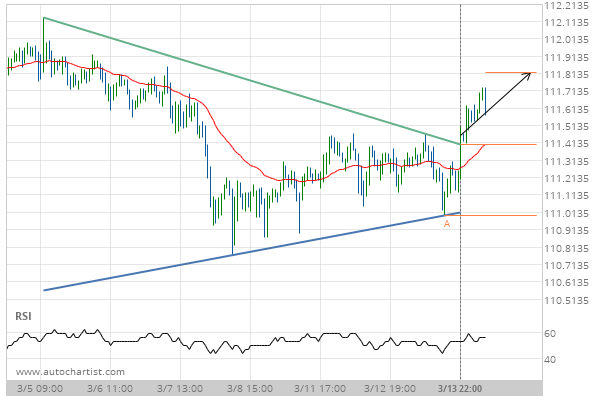
Triangle has broken through the resistance line at 13-Mar-2019 22:00 EDT. Possible bullish price movement forecast for the next 2 days towards 111.8180.
Triangle has broken through the resistance line at 13-Mar-2019 22:00 EDT. Possible bullish price movement forecast for the next 2 days towards 111.8180.