Help & Documentation
  • Home
  • Sign In
  • Contact Us
  • Home
  • Sign In
  • Contact Us

USD/JPY up to 103.3200

/Forex Technical Analysis - TD/USD/JPY up to 103.3200

USD/JPY up to 103.3200

Posted on January 1, 2021 by admin wrote in Forex Technical Analysis - TD.

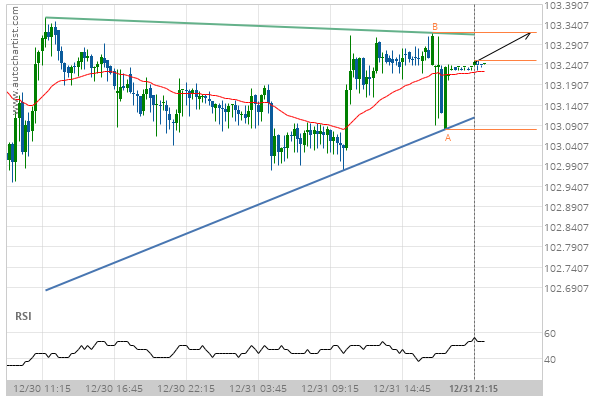
Triangle identified at 31-Dec-2020 21:15 EST. This pattern is still in the process of forming. Possible bullish price movement towards the resistance 103.3200 within the next 5 hours.

Tags: USDJPY
0 Likes
24 Views

You may also like

USD/CHF up to 0.9222
October 7, 2020
GBP/JPY down to 137.5700
November 16, 2020
GBP/USD down to 1.3203
December 7, 2020

Comments are closed.

GBP/CHF down to 1.1870 XAG/USD down to 26.0705

Forex Technical Analysis – TD

EUR/NZD up to 1.7036

January 18, 2021 11:14 am | By admin

Broke through Resistance level of 1.6969 at 18-Jan-2021 04:00 EST Read more →

GBP/CAD down to 1.7269

January 18, 2021 11:14 am | By admin

Approaching Support level of 1.7269 identified at 18-Jan-2021 06:00 EST Read more →

GBP/CHF down to 1.2042

January 18, 2021 11:14 am | By admin

Broke through Support level of 1.2076 at 18-Jan-2021 03:30 EST Read more →

EUR/JPY down to 125.3700

January 18, 2021 11:14 am | By admin

Channel Down identified at 18-Jan-2021 03:30 EST. This pattern is... Read more →

AUD/USD down to 0.7633

January 18, 2021 11:14 am | By admin

Broke through Support level of 0.7678 at 18-Jan-2021 04:00 EST Read more →

  • About Us
  • Privacy Policy
  • Disclaimer
  • Terms and Conditions
  • Get started for FREE
  • Contact Us
Copyright © 2020 Autochartist.com. All rights reserved.
This site uses cookies: Find out more.