Help & Documentation
  • Home
  • Sign In
  • Contact Us
  • Home
  • Sign In
  • Contact Us

US T-Bond up to 181.8750

/Futures Technical Analysis - TD/US T-Bond up to 181.8750

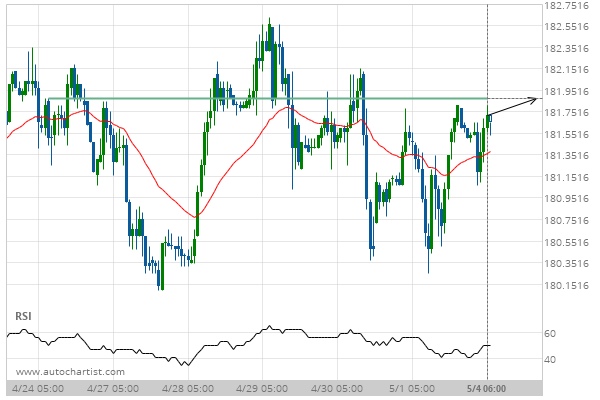
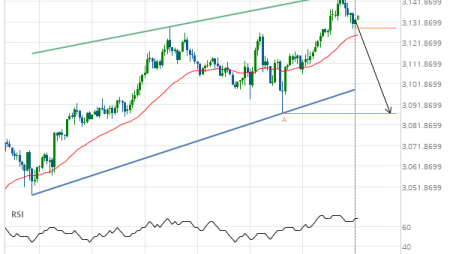
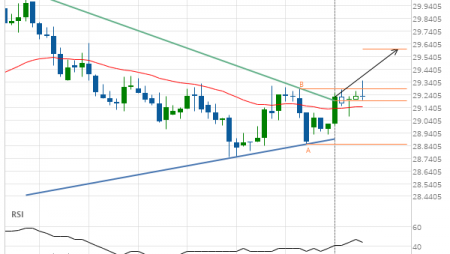
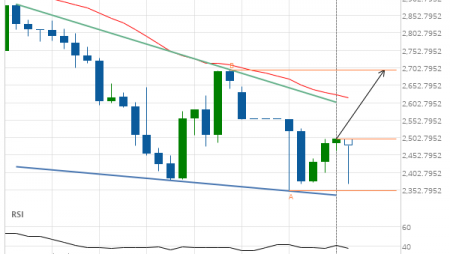
US T-Bond up to 181.8750

Posted on May 4, 2020 by Autochartist wrote in Futures Technical Analysis - TD.

Approaching Resistance level of 181.8750 identified at 04-May-2020 06:00 EDT

Tags: ZB
0 Likes
369 Views

You may also like

US T-Bond up to 174.5000
March 4, 2020
Light Sweet Crude Oil Front Month up to 57.8500
November 15, 2019
Gold Front Month up to 1279.7000
April 19, 2019

Comments are closed.

10 year T-Note up to 139.3594 Silver Front Month up to 15.2550

Futures Technical Analysis – TD

Light Sweet Crude Oil Front Month up to 67.9800

March 9, 2021 11:17 am | By Autochartist

Rising Wedge identified at 09-Mar-2021 05:00 EST. This pattern is... Read more →

Feeder Cattle Front Month down to 137.2250

March 9, 2021 11:17 am | By Autochartist

Channel Down identified at 08-Mar-2021 14:00 EST. This pattern is... Read more →

Soybean Oil up to 53.2300

March 9, 2021 11:17 am | By Autochartist

Channel Up identified at 09-Mar-2021 04:30 EST. This pattern is... Read more →

Silver Front Month up to 26.5600

March 9, 2021 11:17 am | By Autochartist

Approaching Resistance level of 26.5600 identified at 09-Mar-2021 04:00 EST Read more →

10 year T-Note up to 133.1644

March 9, 2021 11:17 am | By Autochartist

Falling Wedge has broken through the resistance line at 09-Mar-2021... Read more →

  • About Us
  • Privacy Policy
  • Disclaimer
  • Terms and Conditions
  • Get started for FREE
  • Contact Us
Copyright © 2020 Autochartist.com. All rights reserved.
This site uses cookies: Find out more.