Help & Documentation
  • Home
  • Sign In
  • Contact Us
  • Home
  • Sign In
  • Contact Us

US T-Bond up to 179.7594

/Futures Technical Analysis - TD/US T-Bond up to 179.7594

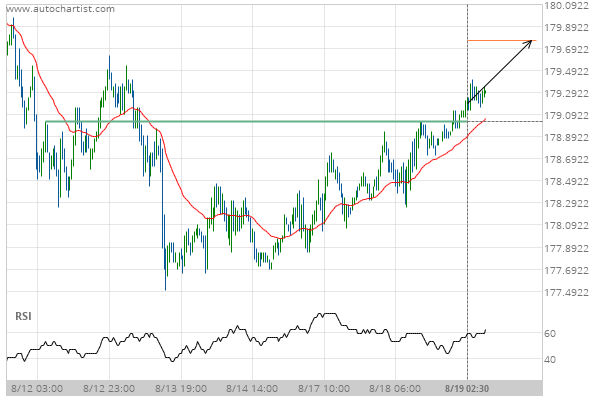
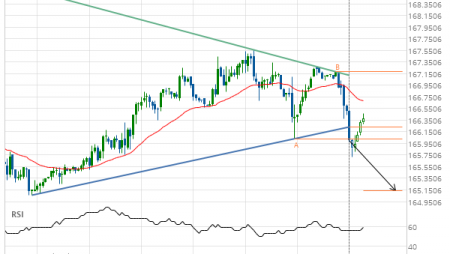
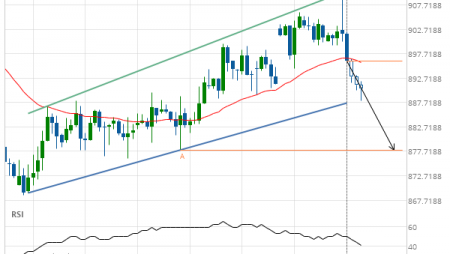
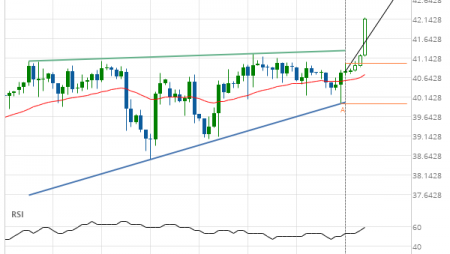
US T-Bond up to 179.7594

Posted on August 19, 2020 by Autochartist wrote in Futures Technical Analysis - TD.

Broke through Resistance level of 179.0313 at 19-Aug-2020 02:30 EDT

Tags: ZB
0 Likes
299 Views

You may also like

Soybean Meal up to 304.9000
February 28, 2020
Corn down to 371.0000
January 24, 2019
Silver Front Month down to 14.9339
April 26, 2019

Comments are closed.

Nike Inc. Cl B () up to 107.94 Silver Front Month down to 26.3900

Futures Technical Analysis – TD

Light Sweet Crude Oil Front Month up to 67.9800

March 9, 2021 11:17 am | By Autochartist

Rising Wedge identified at 09-Mar-2021 05:00 EST. This pattern is... Read more →

Feeder Cattle Front Month down to 137.2250

March 9, 2021 11:17 am | By Autochartist

Channel Down identified at 08-Mar-2021 14:00 EST. This pattern is... Read more →

Soybean Oil up to 53.2300

March 9, 2021 11:17 am | By Autochartist

Channel Up identified at 09-Mar-2021 04:30 EST. This pattern is... Read more →

Silver Front Month up to 26.5600

March 9, 2021 11:17 am | By Autochartist

Approaching Resistance level of 26.5600 identified at 09-Mar-2021 04:00 EST Read more →

10 year T-Note up to 133.1644

March 9, 2021 11:17 am | By Autochartist

Falling Wedge has broken through the resistance line at 09-Mar-2021... Read more →

  • About Us
  • Privacy Policy
  • Disclaimer
  • Terms and Conditions
  • Get started for FREE
  • Contact Us
Copyright © 2020 Autochartist.com. All rights reserved.
This site uses cookies: Find out more.