Help & Documentation
  • Home
  • Sign In
  • Contact Us
  • Home
  • Sign In
  • Contact Us

US T-Bond up to 179.2188

/Futures Technical Analysis - TD/US T-Bond up to 179.2188

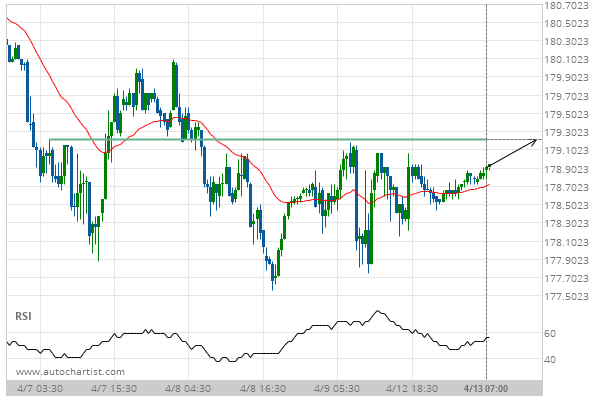
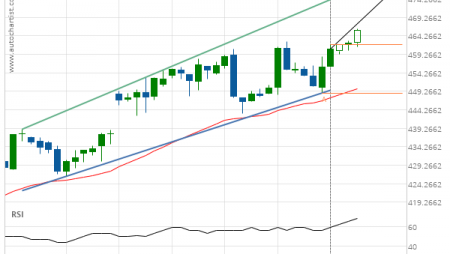
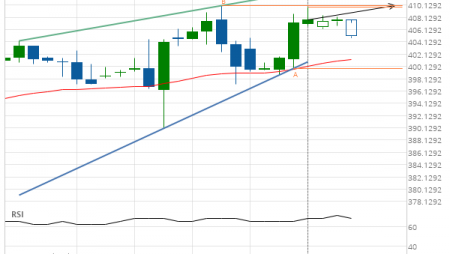
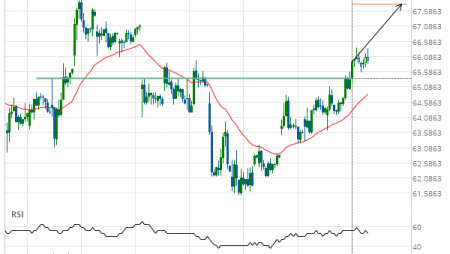
US T-Bond up to 179.2188

Posted on April 13, 2020 by Autochartist wrote in Futures Technical Analysis - TD.

Approaching Resistance level of 179.2188 identified at 13-Apr-2020 07:00 EDT

Tags: ZB
0 Likes
535 Views

You may also like

10 year T-Note down to 138.7813
May 21, 2020
KC HRW Wheat down to 548.2500
November 12, 2020
Feeder Cattle Front Month down to 106.5750
April 3, 2020

Comments are closed.

10 year T-Note down to 137.6563 E-mini S&P 500 up to 2819.5000

Futures Technical Analysis – TD

Light Sweet Crude Oil Front Month up to 67.9800

March 9, 2021 11:17 am | By Autochartist

Rising Wedge identified at 09-Mar-2021 05:00 EST. This pattern is... Read more →

Feeder Cattle Front Month down to 137.2250

March 9, 2021 11:17 am | By Autochartist

Channel Down identified at 08-Mar-2021 14:00 EST. This pattern is... Read more →

Soybean Oil up to 53.2300

March 9, 2021 11:17 am | By Autochartist

Channel Up identified at 09-Mar-2021 04:30 EST. This pattern is... Read more →

Silver Front Month up to 26.5600

March 9, 2021 11:17 am | By Autochartist

Approaching Resistance level of 26.5600 identified at 09-Mar-2021 04:00 EST Read more →

10 year T-Note up to 133.1644

March 9, 2021 11:17 am | By Autochartist

Falling Wedge has broken through the resistance line at 09-Mar-2021... Read more →

  • About Us
  • Privacy Policy
  • Disclaimer
  • Terms and Conditions
  • Get started for FREE
  • Contact Us
Copyright © 2022 Autochartist.com. All rights reserved.
This site uses cookies: Find out more.