Help & Documentation
  • Home
  • Sign In
  • Contact Us
  • Home
  • Sign In
  • Contact Us

US T-Bond up to 174.3125

/Futures Technical Analysis - TD/US T-Bond up to 174.3125

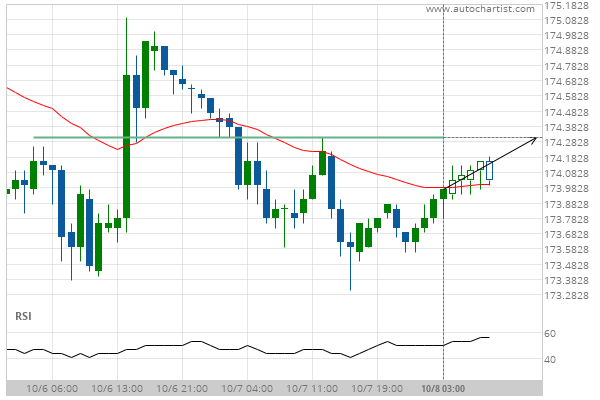
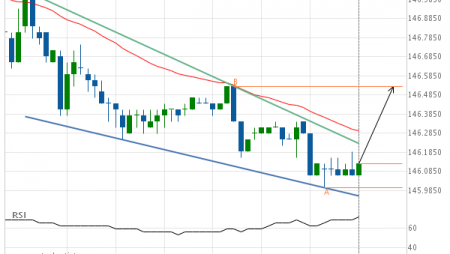
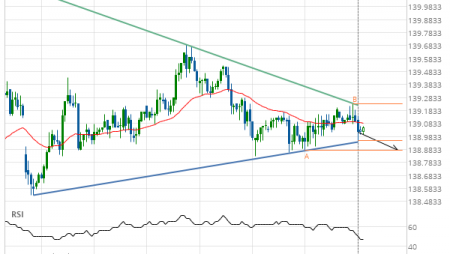
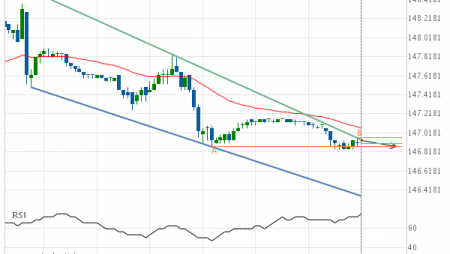
US T-Bond up to 174.3125

Posted on October 8, 2020 by Autochartist wrote in Futures Technical Analysis - TD.

Approaching Resistance level of 174.3125 identified at 08-Oct-2020 03:00 EDT

Tags: ZB
0 Likes
385 Views

You may also like

Gold Front Month down to 1863.1000
July 23, 2020
Silver Front Month up to 15.8709
February 8, 2019
Soybean Meal up to 328.1000
June 3, 2019

Comments are closed.

E-mini S&P 500 down to 3332.2500 Silver Front Month up to 24.8050

Futures Technical Analysis – TD

Light Sweet Crude Oil Front Month up to 67.9800

March 9, 2021 11:17 am | By Autochartist

Rising Wedge identified at 09-Mar-2021 05:00 EST. This pattern is... Read more →

Feeder Cattle Front Month down to 137.2250

March 9, 2021 11:17 am | By Autochartist

Channel Down identified at 08-Mar-2021 14:00 EST. This pattern is... Read more →

Soybean Oil up to 53.2300

March 9, 2021 11:17 am | By Autochartist

Channel Up identified at 09-Mar-2021 04:30 EST. This pattern is... Read more →

Silver Front Month up to 26.5600

March 9, 2021 11:17 am | By Autochartist

Approaching Resistance level of 26.5600 identified at 09-Mar-2021 04:00 EST Read more →

10 year T-Note up to 133.1644

March 9, 2021 11:17 am | By Autochartist

Falling Wedge has broken through the resistance line at 09-Mar-2021... Read more →

  • About Us
  • Privacy Policy
  • Disclaimer
  • Terms and Conditions
  • Get started for FREE
  • Contact Us
Copyright © 2022 Autochartist.com. All rights reserved.
This site uses cookies: Find out more.