Help & Documentation
  • Home
  • Sign In
  • Contact Us
  • Home
  • Sign In
  • Contact Us

US T-Bond up to 169.4632

/Futures Technical Analysis - TD/US T-Bond up to 169.4632

US T-Bond up to 169.4632

Posted on January 11, 2021 by admin wrote in Futures Technical Analysis - TD.

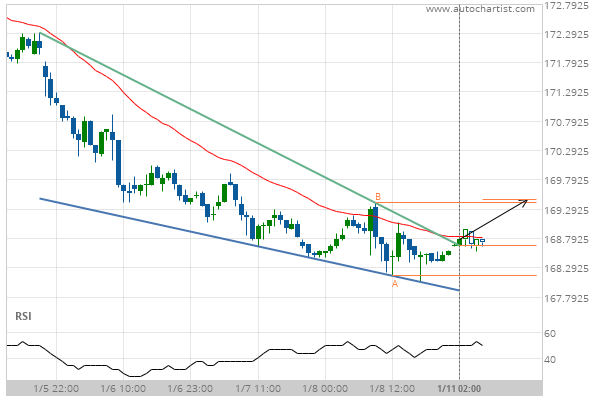
Falling Wedge has broken through the resistance line at 11-Jan-2021 02:00 EST. Possible bullish price movement forecast for the next 20 hours towards 169.4632.

Tags: CBOT-GBX, ZB
0 Likes
19 Views

You may also like

Lean Hogs up to 57.3100
July 24, 2020
Live Cattle down to 125.9431
February 14, 2019
10 year T-Note up to 127.6875
July 24, 2019

Comments are closed.

Corn down to 486.3358 Gold Front Month excessive bearish movement

Futures Technical Analysis – TD

KC HRW Wheat up to 645.2500

January 26, 2021 11:14 am | By admin

Approaching Resistance level of 645.2500 identified at 26-Jan-2021 04:00 EST Read more →

Corn up to 536.5000

January 26, 2021 11:13 am | By admin

Approaching Resistance level of 536.5000 identified at 26-Jan-2021 06:00 EST Read more →

Soybean Oil up to 43.6800

January 26, 2021 11:13 am | By admin

Rising Wedge identified at 26-Jan-2021 05:00 EST. This pattern is... Read more →

Light Sweet Crude Oil Front Month up to 53.9300

January 26, 2021 11:13 am | By admin

Approaching Resistance level of 53.9300 identified at 26-Jan-2021 05:00 EST Read more →

Silver Front Month up to 25.8350

January 26, 2021 11:13 am | By admin

Triangle identified at 26-Jan-2021 05:00 EST. This pattern is still... Read more →

  • About Us
  • Privacy Policy
  • Disclaimer
  • Terms and Conditions
  • Get started for FREE
  • Contact Us
Copyright © 2020 Autochartist.com. All rights reserved.
This site uses cookies: Find out more.