Help & Documentation
  • Home
  • Sign In
  • Contact Us
  • Home
  • Sign In
  • Contact Us

US T-Bond up to 168.3938

/Futures Technical Analysis - TD/US T-Bond up to 168.3938

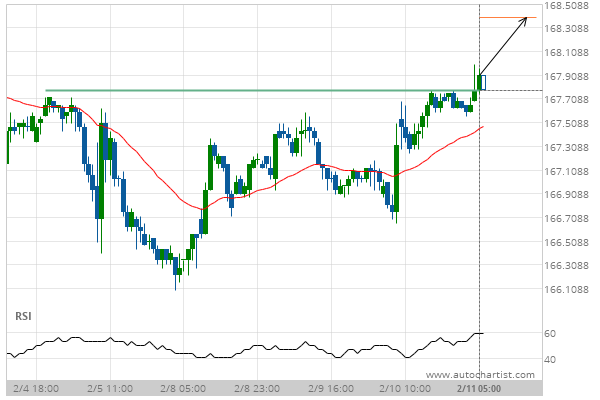
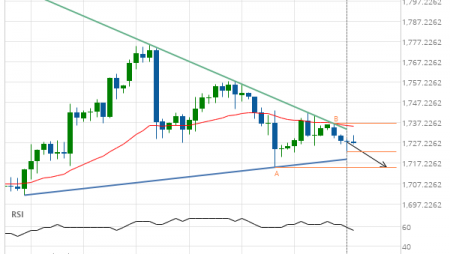
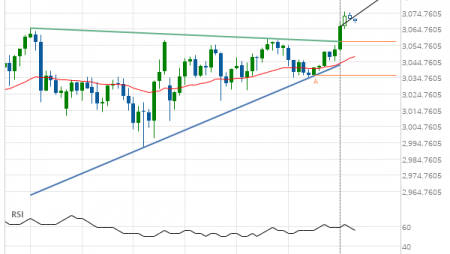
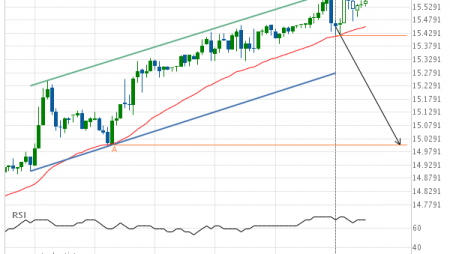
US T-Bond up to 168.3938

Posted on February 11, 2021 by Autochartist wrote in Futures Technical Analysis - TD.

Broke through Resistance level of 167.7813 at 11-Feb-2021 05:00 EST

Tags: ZB
0 Likes
241 Views

You may also like

Corn down to 309.9005
August 12, 2020
Soybean Meal down to 291.0000
April 10, 2020
Gold Front Month up to 1328.6000
February 5, 2019

Comments are closed.

10 year T-Note up to 137.1953 Silver Front Month down to 25.9350

Futures Technical Analysis – TD

Light Sweet Crude Oil Front Month up to 67.9800

March 9, 2021 11:17 am | By Autochartist

Rising Wedge identified at 09-Mar-2021 05:00 EST. This pattern is... Read more →

Feeder Cattle Front Month down to 137.2250

March 9, 2021 11:17 am | By Autochartist

Channel Down identified at 08-Mar-2021 14:00 EST. This pattern is... Read more →

Soybean Oil up to 53.2300

March 9, 2021 11:17 am | By Autochartist

Channel Up identified at 09-Mar-2021 04:30 EST. This pattern is... Read more →

Silver Front Month up to 26.5600

March 9, 2021 11:17 am | By Autochartist

Approaching Resistance level of 26.5600 identified at 09-Mar-2021 04:00 EST Read more →

10 year T-Note up to 133.1644

March 9, 2021 11:17 am | By Autochartist

Falling Wedge has broken through the resistance line at 09-Mar-2021... Read more →

  • About Us
  • Privacy Policy
  • Disclaimer
  • Terms and Conditions
  • Get started for FREE
  • Contact Us
Copyright © 2020 Autochartist.com. All rights reserved.
This site uses cookies: Find out more.