Help & Documentation
  • Home
  • Sign In
  • Contact Us
  • Home
  • Sign In
  • Contact Us

US T-Bond up to 163.3750

/Futures Technical Analysis - TD/US T-Bond up to 163.3750

US T-Bond up to 163.3750

Posted on January 31, 2020 by Autochartist wrote in Futures Technical Analysis - TD.

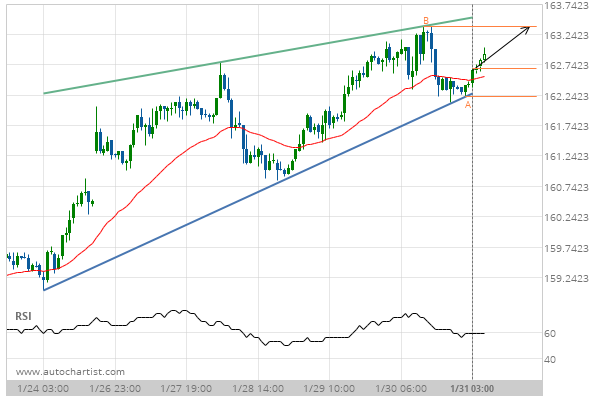
Rising Wedge identified at 31-Jan-2020 03:00 EST. This pattern is still in the process of forming. Possible bullish price movement towards the resistance 163.3750 within the next day.

Tags: CBOT, ZB
0 Likes
696 Views

You may also like

Soybeans up to 952.5000
December 31, 2019
Soybeans down to 931.0000
October 30, 2019
Live Cattle down to 119.2750
April 10, 2019

Comments are closed.

Soybeans down to 875.5000 10 year T-Note up to 131.5313

Futures Technical Analysis – TD

Light Sweet Crude Oil Front Month up to 67.9800

March 9, 2021 11:17 am | By Autochartist

Rising Wedge identified at 09-Mar-2021 05:00 EST. This pattern is... Read more →

Feeder Cattle Front Month down to 137.2250

March 9, 2021 11:17 am | By Autochartist

Channel Down identified at 08-Mar-2021 14:00 EST. This pattern is... Read more →

Soybean Oil up to 53.2300

March 9, 2021 11:17 am | By Autochartist

Channel Up identified at 09-Mar-2021 04:30 EST. This pattern is... Read more →

Silver Front Month up to 26.5600

March 9, 2021 11:17 am | By Autochartist

Approaching Resistance level of 26.5600 identified at 09-Mar-2021 04:00 EST Read more →

10 year T-Note up to 133.1644

March 9, 2021 11:17 am | By Autochartist

Falling Wedge has broken through the resistance line at 09-Mar-2021... Read more →

  • About Us
  • Privacy Policy
  • Disclaimer
  • Terms and Conditions
  • Get started for FREE
  • Contact Us
Copyright © 2022 Autochartist.com. All rights reserved.
This site uses cookies: Find out more.