Help & Documentation
  • Home
  • Sign In
  • Contact Us
  • Home
  • Sign In
  • Contact Us

US T-Bond up to 158.5313

/Futures Technical Analysis - TD/US T-Bond up to 158.5313

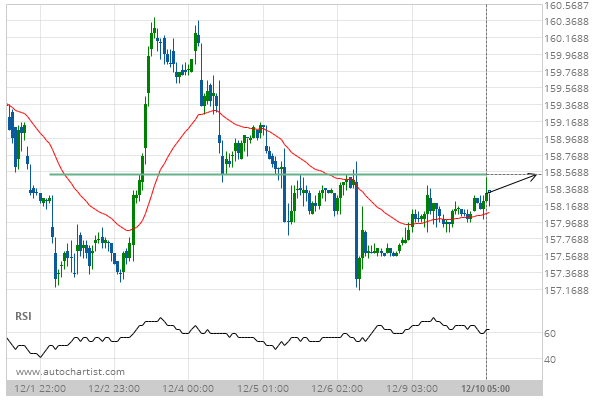
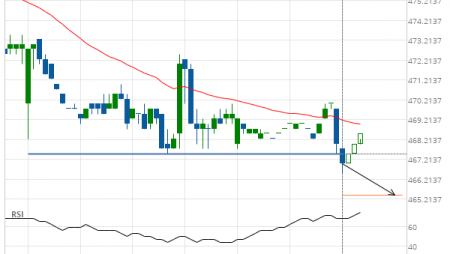
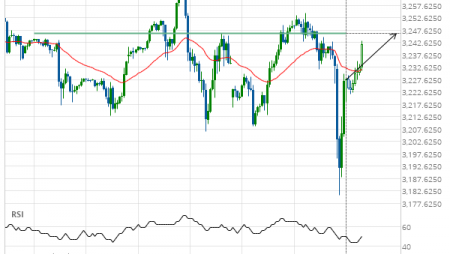
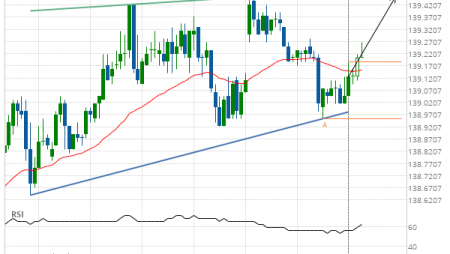
US T-Bond up to 158.5313

Posted on December 10, 2019 by Autochartist wrote in Futures Technical Analysis - TD.

Approaching Resistance level of 158.5313 identified at 10-Dec-2019 05:00 EST

Tags: ZB
0 Likes
504 Views

You may also like

Soybean Meal up to 316.0371
January 31, 2019
Gold Front Month up to 1580.2000
February 10, 2020
Gold Front Month up to 1939.4000
October 16, 2020

Comments are closed.

Corn down to 374.1596 10 year T-Note up to 129.4531

Futures Technical Analysis – TD

Light Sweet Crude Oil Front Month up to 67.9800

March 9, 2021 11:17 am | By Autochartist

Rising Wedge identified at 09-Mar-2021 05:00 EST. This pattern is... Read more →

Feeder Cattle Front Month down to 137.2250

March 9, 2021 11:17 am | By Autochartist

Channel Down identified at 08-Mar-2021 14:00 EST. This pattern is... Read more →

Soybean Oil up to 53.2300

March 9, 2021 11:17 am | By Autochartist

Channel Up identified at 09-Mar-2021 04:30 EST. This pattern is... Read more →

Silver Front Month up to 26.5600

March 9, 2021 11:17 am | By Autochartist

Approaching Resistance level of 26.5600 identified at 09-Mar-2021 04:00 EST Read more →

10 year T-Note up to 133.1644

March 9, 2021 11:17 am | By Autochartist

Falling Wedge has broken through the resistance line at 09-Mar-2021... Read more →

  • About Us
  • Privacy Policy
  • Disclaimer
  • Terms and Conditions
  • Get started for FREE
  • Contact Us
Copyright © 2020 Autochartist.com. All rights reserved.
This site uses cookies: Find out more.