Help & Documentation
  • Home
  • Sign In
  • Contact Us
  • Home
  • Sign In
  • Contact Us

US T-Bond up to 154.1875

/Futures Technical Analysis - TD/US T-Bond up to 154.1875

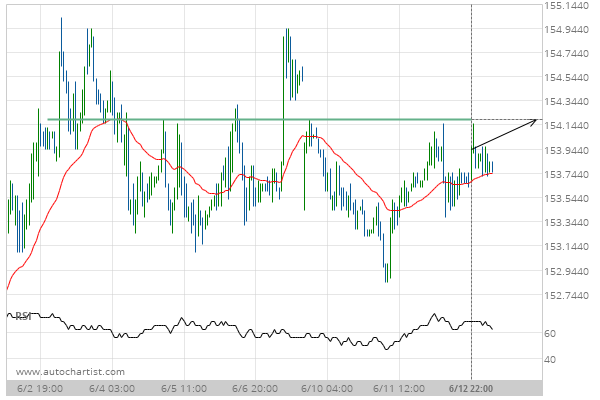
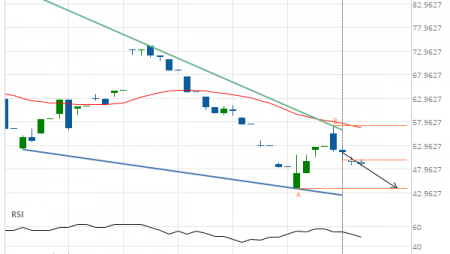
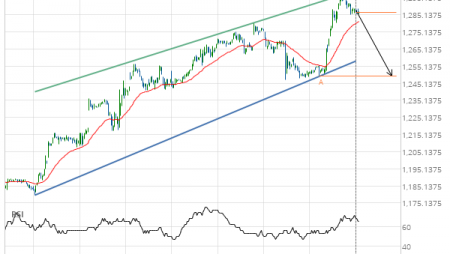
US T-Bond up to 154.1875

Posted on June 13, 2019 by Autochartist wrote in Futures Technical Analysis - TD.

Approaching Resistance level of 154.1875 identified at 12-Jun-2019 22:00 EDT

Tags: ZB
0 Likes
851 Views

You may also like

Light Sweet Crude Oil Front Month up to 58.4700
August 1, 2019
Soybeans up to 848.2500
May 21, 2019
Light Sweet Crude Oil Front Month down to 37.0400
October 29, 2020

Comments are closed.

Visa is on its way up Silver Front Month up to 14.8700

Futures Technical Analysis – TD

Light Sweet Crude Oil Front Month up to 67.9800

March 9, 2021 11:17 am | By Autochartist

Rising Wedge identified at 09-Mar-2021 05:00 EST. This pattern is... Read more →

Feeder Cattle Front Month down to 137.2250

March 9, 2021 11:17 am | By Autochartist

Channel Down identified at 08-Mar-2021 14:00 EST. This pattern is... Read more →

Soybean Oil up to 53.2300

March 9, 2021 11:17 am | By Autochartist

Channel Up identified at 09-Mar-2021 04:30 EST. This pattern is... Read more →

Silver Front Month up to 26.5600

March 9, 2021 11:17 am | By Autochartist

Approaching Resistance level of 26.5600 identified at 09-Mar-2021 04:00 EST Read more →

10 year T-Note up to 133.1644

March 9, 2021 11:17 am | By Autochartist

Falling Wedge has broken through the resistance line at 09-Mar-2021... Read more →

  • About Us
  • Privacy Policy
  • Disclaimer
  • Terms and Conditions
  • Get started for FREE
  • Contact Us
Copyright © 2022 Autochartist.com. All rights reserved.
This site uses cookies: Find out more.