Help & Documentation
  • Home
  • Sign In
  • Contact Us
  • Home
  • Sign In
  • Contact Us

US T-Bond up to 151.4543

/Futures Technical Analysis - TD/US T-Bond up to 151.4543

US T-Bond up to 151.4543

Posted on May 27, 2019 by Autochartist wrote in Futures Technical Analysis - TD.

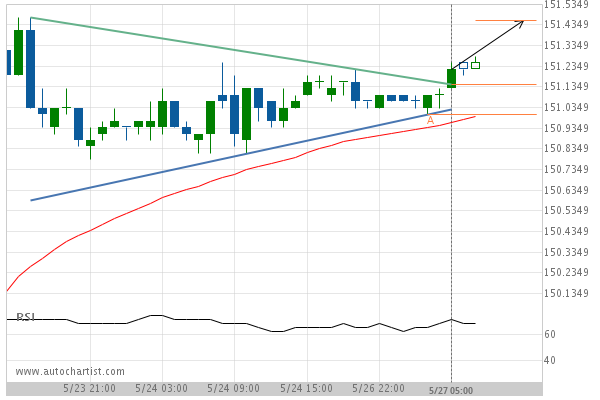
Triangle has broken through the resistance line at 27-May-2019 05:00 EDT. Possible bullish price movement forecast for the next 9 hours towards 151.4543.

Tags: CBOT, ZB
0 Likes
778 Views

You may also like

Light Sweet Crude Oil Front Month down to 40.1000
July 22, 2020
CORN MARCH 2021 down to 415.2500
December 11, 2020
Soybean Oil up to 28.8400
March 28, 2019

Comments are closed.

GBP/USD down to 1.2646 Light Sweet Crude Oil Front Month down to 57.3300

Futures Technical Analysis – TD

Light Sweet Crude Oil Front Month up to 67.9800

March 9, 2021 11:17 am | By Autochartist

Rising Wedge identified at 09-Mar-2021 05:00 EST. This pattern is... Read more →

Feeder Cattle Front Month down to 137.2250

March 9, 2021 11:17 am | By Autochartist

Channel Down identified at 08-Mar-2021 14:00 EST. This pattern is... Read more →

Soybean Oil up to 53.2300

March 9, 2021 11:17 am | By Autochartist

Channel Up identified at 09-Mar-2021 04:30 EST. This pattern is... Read more →

Silver Front Month up to 26.5600

March 9, 2021 11:17 am | By Autochartist

Approaching Resistance level of 26.5600 identified at 09-Mar-2021 04:00 EST Read more →

10 year T-Note up to 133.1644

March 9, 2021 11:17 am | By Autochartist

Falling Wedge has broken through the resistance line at 09-Mar-2021... Read more →

  • About Us
  • Privacy Policy
  • Disclaimer
  • Terms and Conditions
  • Get started for FREE
  • Contact Us
Copyright © 2022 Autochartist.com. All rights reserved.
This site uses cookies: Find out more.