Help & Documentation
  • Home
  • Sign In
  • Contact Us
  • Home
  • Sign In
  • Contact Us

US T-Bond up to 146.0996

/Futures Technical Analysis - TD/US T-Bond up to 146.0996

US T-Bond up to 146.0996

Posted on January 23, 2019 by Autochartist wrote in Futures Technical Analysis - TD.

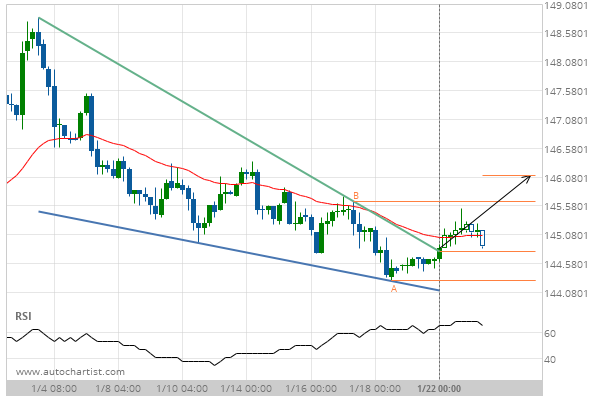
Falling Wedge has broken through the resistance line at 22-Jan-2019 00:00 EST. Possible bullish price movement forecast for the next 3 days towards 146.0996.

Tags: CBOT, ZB
0 Likes
884 Views

You may also like

Light Sweet Crude Oil Front Month up to 61.9600
December 27, 2019
KC HRW Wheat down to 526.0000
October 14, 2020
Soybeans down to 879.2500
February 26, 2020

Comments are closed.

10 year T-Note down to 121.3238 E-mini S&P 500 up to 2645.5000

Futures Technical Analysis – TD

Light Sweet Crude Oil Front Month up to 67.9800

March 9, 2021 11:17 am | By Autochartist

Rising Wedge identified at 09-Mar-2021 05:00 EST. This pattern is... Read more →

Feeder Cattle Front Month down to 137.2250

March 9, 2021 11:17 am | By Autochartist

Channel Down identified at 08-Mar-2021 14:00 EST. This pattern is... Read more →

Soybean Oil up to 53.2300

March 9, 2021 11:17 am | By Autochartist

Channel Up identified at 09-Mar-2021 04:30 EST. This pattern is... Read more →

Silver Front Month up to 26.5600

March 9, 2021 11:17 am | By Autochartist

Approaching Resistance level of 26.5600 identified at 09-Mar-2021 04:00 EST Read more →

10 year T-Note up to 133.1644

March 9, 2021 11:17 am | By Autochartist

Falling Wedge has broken through the resistance line at 09-Mar-2021... Read more →

  • About Us
  • Privacy Policy
  • Disclaimer
  • Terms and Conditions
  • Get started for FREE
  • Contact Us
Copyright © 2022 Autochartist.com. All rights reserved.
This site uses cookies: Find out more.