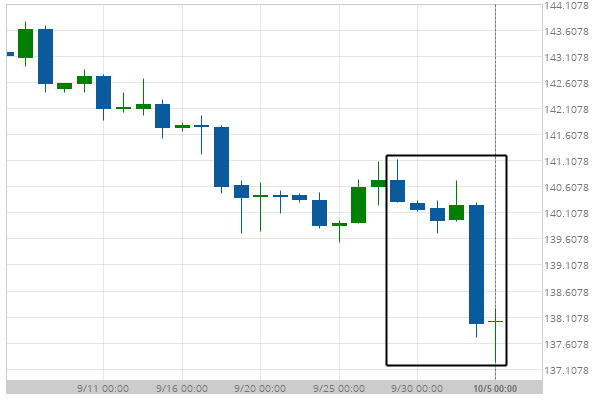
US T-Bond excessive bearish movement Posted on October 5, 2018 by Autochartist wrote in Futures Statistical Analysis - TD. US T-Bond experienced a 1.93% bearish movement in the last 6 days. Tags: Big Movement, ZB 0 Likes 1473 Views You may also like E-mini S&P 500 excessive bullish movement April 9, 2020 Light Sweet Crude Oil Front Month excessive bearish movement March 5, 2021 Gold Front Month excessive bearish movement February 20, 2019 Comments are closed.