Help & Documentation
  • Home
  • Sign In
  • Contact Us
  • Home
  • Sign In
  • Contact Us

US T-Bond excessive bearish movement

/Futures Statistical Analysis - TD/US T-Bond excessive bearish movement

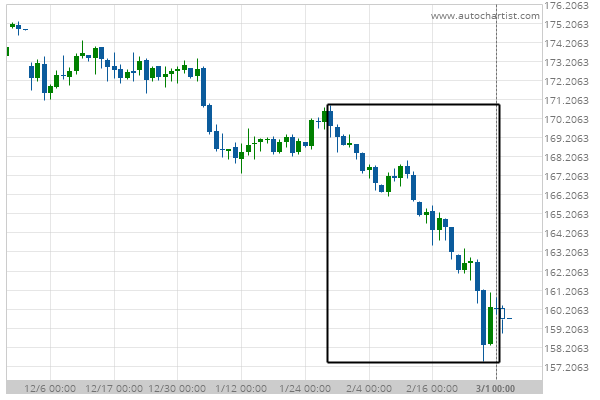
US T-Bond excessive bearish movement

Posted on March 2, 2021 by admin wrote in Futures Statistical Analysis - TD.

US T-Bond experienced a 5.65% bearish movement in the last 32 days.

Tags: Big Movement, ZB
0 Likes
50 Views

You may also like

E-mini S&P 500 excessive bullish movement
April 9, 2020
KC HRW Wheat excessive bearish movement
December 17, 2019
Feeder Cattle Front Month excessive bullish movement
July 21, 2020

Comments are closed.

Verizon Communications Inc. (VZ) down to 55.27 Light Sweet Crude Oil Front Month excessive bearish movement

Futures Statistical Analysis – TD

Soybean Oil excessive bearish movement

March 9, 2021 11:16 am | By admin

Soybean Oil experienced a 19.04% bullish movement in the last... Read more →

Corn excessive bearish movement

March 8, 2021 11:19 am | By admin

Corn experienced a 4.61% bullish movement in the last 73... Read more →

Gold Front Month excessive bearish movement

March 8, 2021 11:19 am | By admin

Gold Front Month experienced a 6.29% bearish movement in the... Read more →

Light Sweet Crude Oil Front Month excessive bearish movement

March 8, 2021 11:19 am | By admin

Light Sweet Crude Oil Front Month experienced a 8.6% bullish... Read more →

10 year T-Note excessive bearish movement

March 8, 2021 11:19 am | By admin

10 year T-Note experienced a 3.4% bearish movement in the... Read more →

  • About Us
  • Privacy Policy
  • Disclaimer
  • Terms and Conditions
  • Get started for FREE
  • Contact Us
Copyright © 2020 Autochartist.com. All rights reserved.
This site uses cookies: Find out more.